Innovating in railway transport supervision
13/01/2025 - 4 min. de lecture
In 2017, I participated with Use Design in a project for SNCF: our mission was to find innovation paths for improving railway transport supervision. In a context of growing traffic, increasing intermodality, and new uses related to new means of communication, our team was tasked with thinking about interface solutions for railway operations to identify improvement opportunities and respond to the new challenges of the railway industry.
Understanding the present to visualize the future of railway operations
Businesses and designers are keen on innovation, as well they should be. But the better you know the current state of things and why they’re like that, the better you will be positioned to innovate.
On the tracks, on the platforms, problems interpenetrate and add up. The particular nature of railway transport, which is difficult to perceive at the user level, produces, at the slightest breakdown, a snowball effect that can prove very hard to control, with a state of fluid traffic very long to restore. Trains inexorably run late, platforms fill up, stations saturate.
It’s the transport plan, established the previous year, that determines the precise passing time of each train. It’s this order of things that the internal team we work with questions with this project.
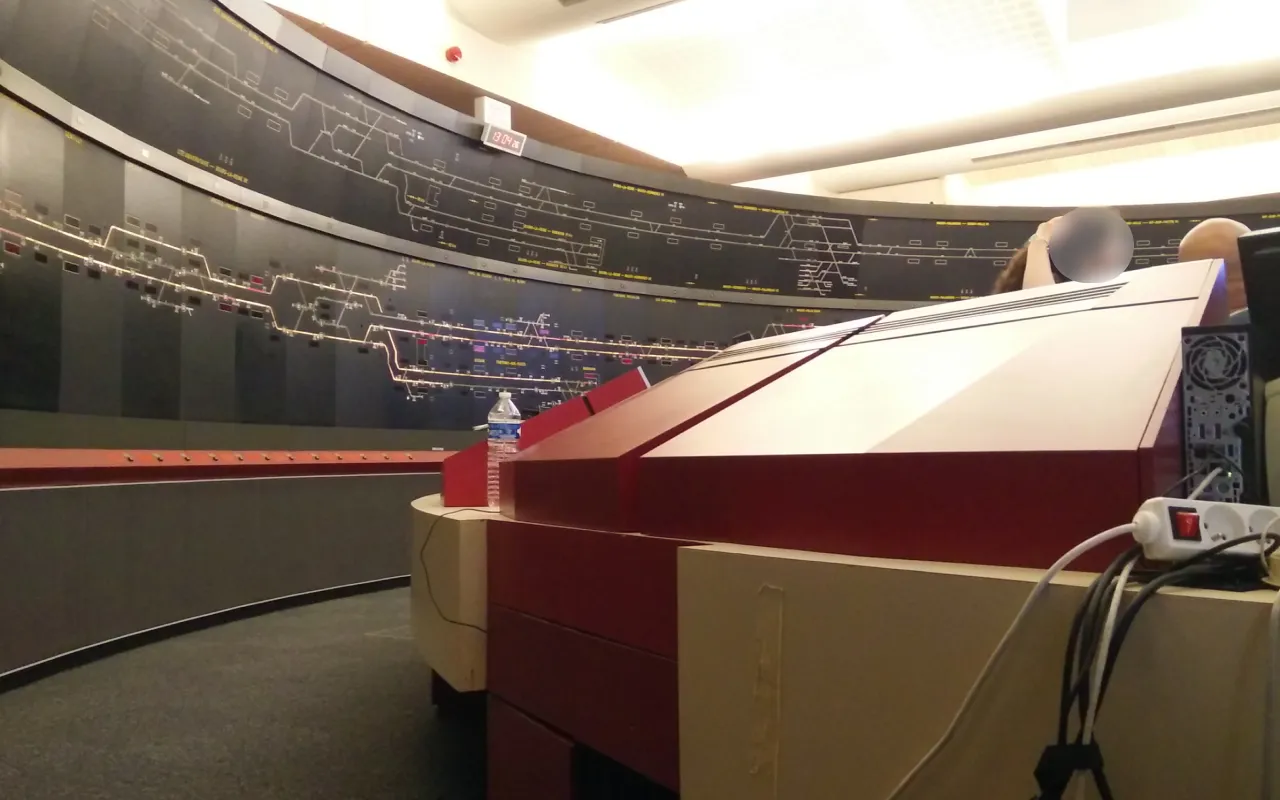
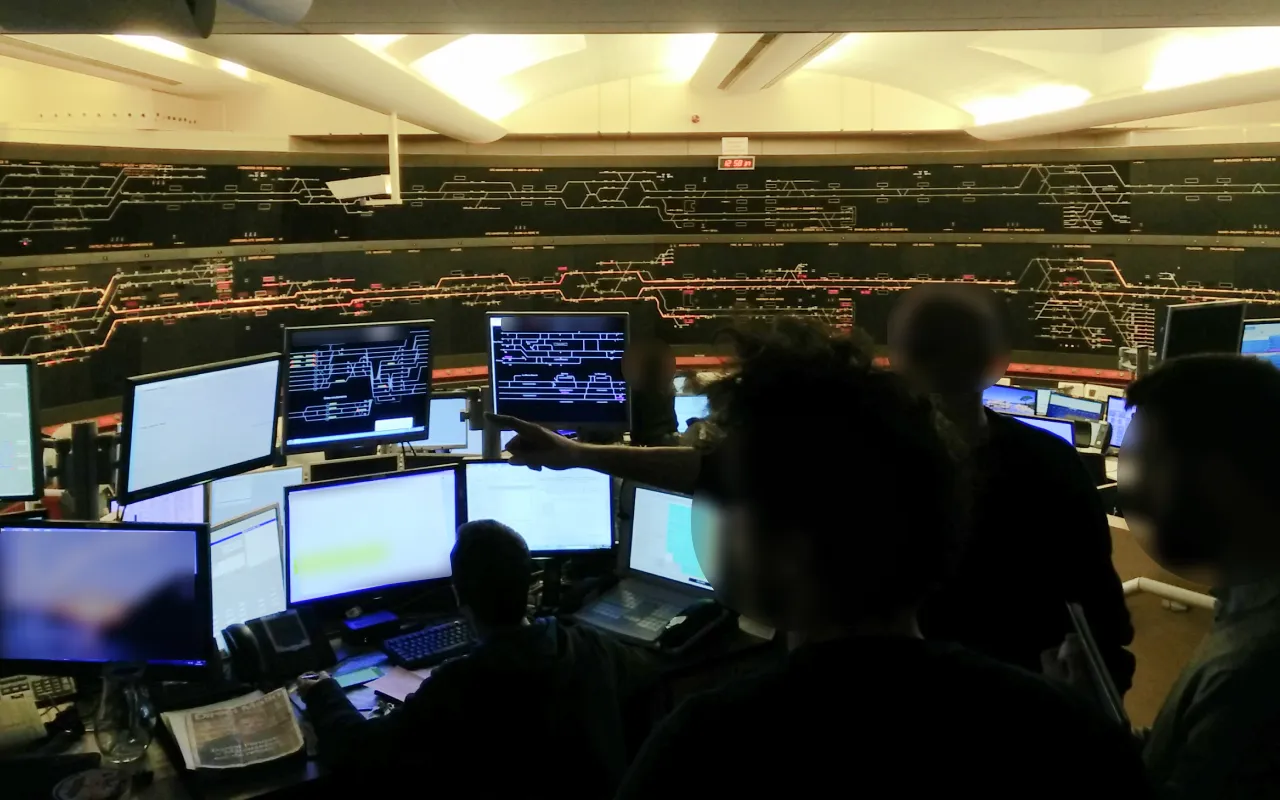
Our mission is to understand the operators’ business and propose solutions that will facilitate information gathering. A few visits to the control centers of Denfert-Rochereau and Saint-Lazare allowed us to sense the nature of the work of the personnel in charge of this supervision.
Entering the bowels of SNCF is a fascinating experience. In this control room, we can perceive several things: the company has a well-oiled and proven mechanism. At the same time, the weight of this organization creates blind spots: the notion of passenger is considered as an inevitable corollary, and not as a central element. The passenger disappears under this obsession of the manager to make the right train pass at the right time.
Building on the best of what exists
Our objective is to offer network managers a tool that allows them to maintain traffic fluidity, better manage internal resources and rolling stock, and improve passenger comfort. As we’ve seen, this point needs improvement at the network supervision level.
Several reflection workshops with SNCF allowed us to filter our first insights and know their relevance. We also gathered valuable explanations about what we had seen in the field, and about how field actors perceive their work and their action.
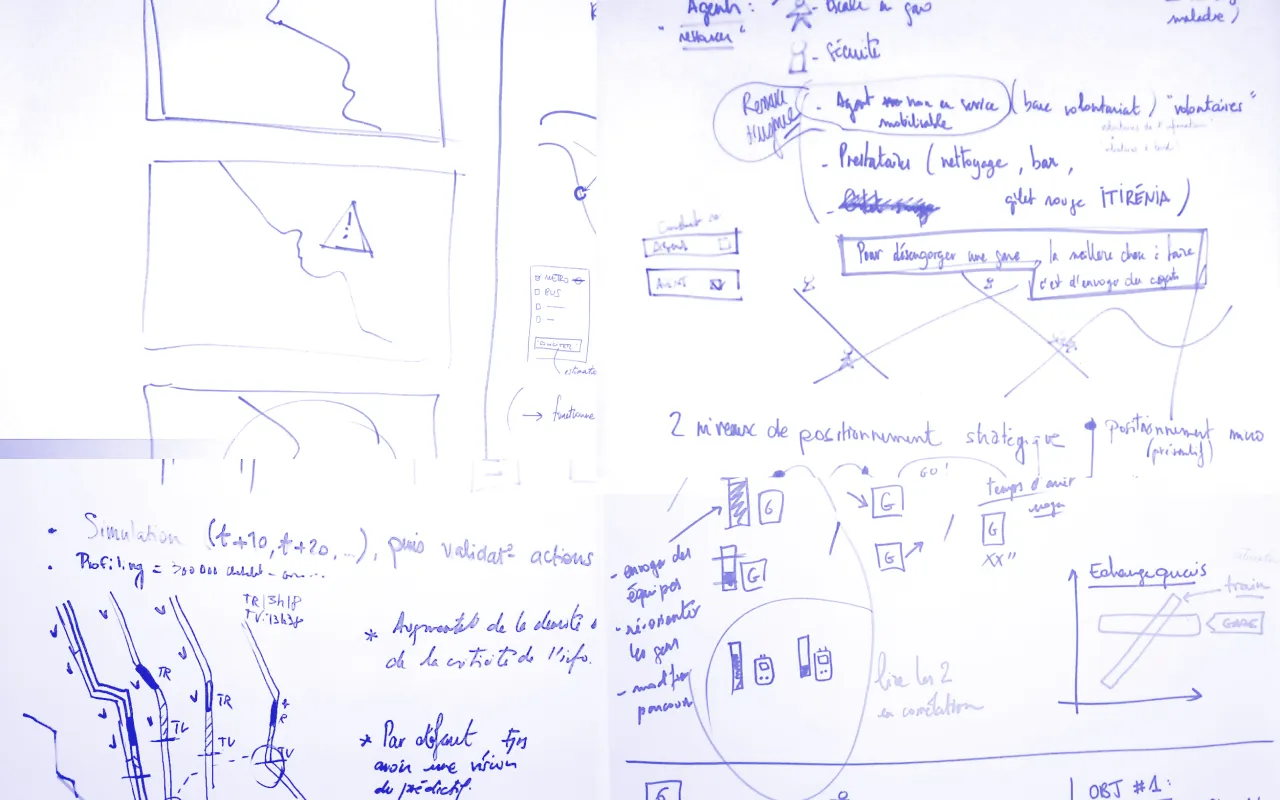
Our work then developed along the following axes:
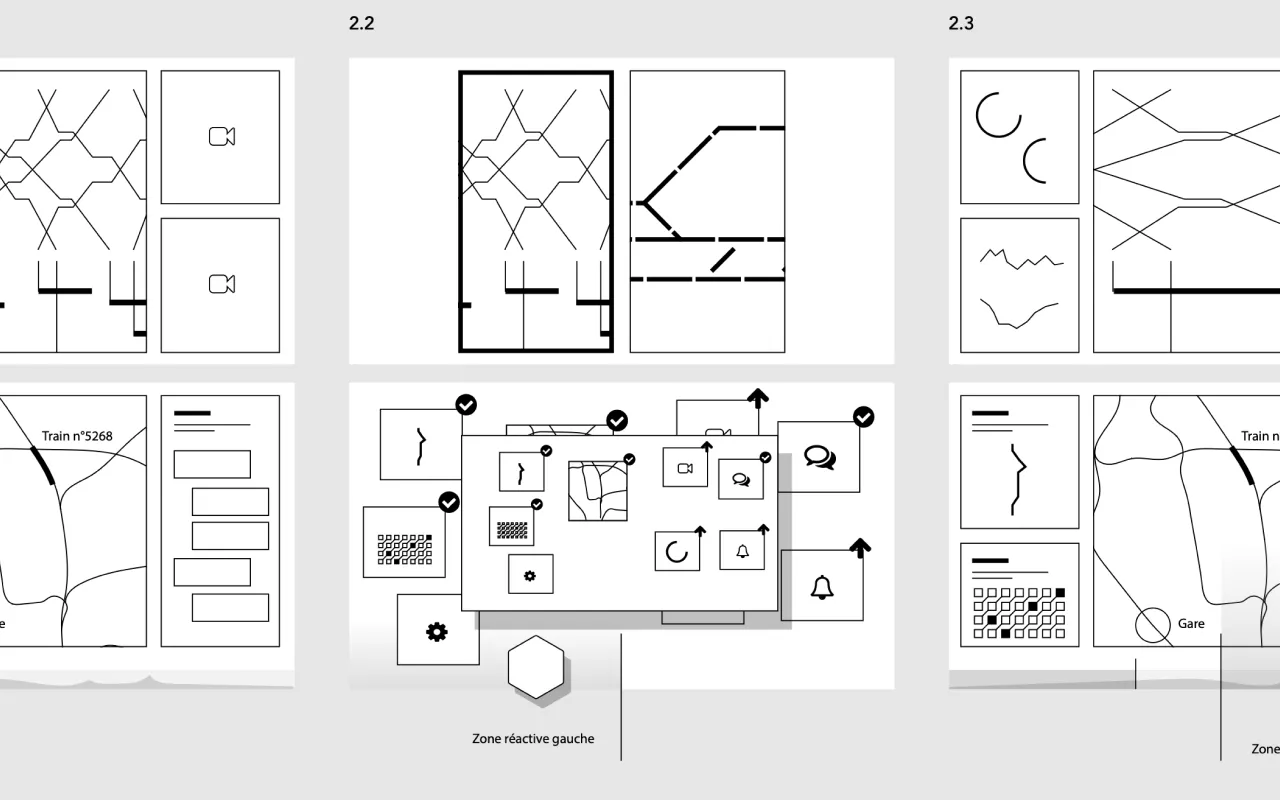
Different representations help visualize the situation
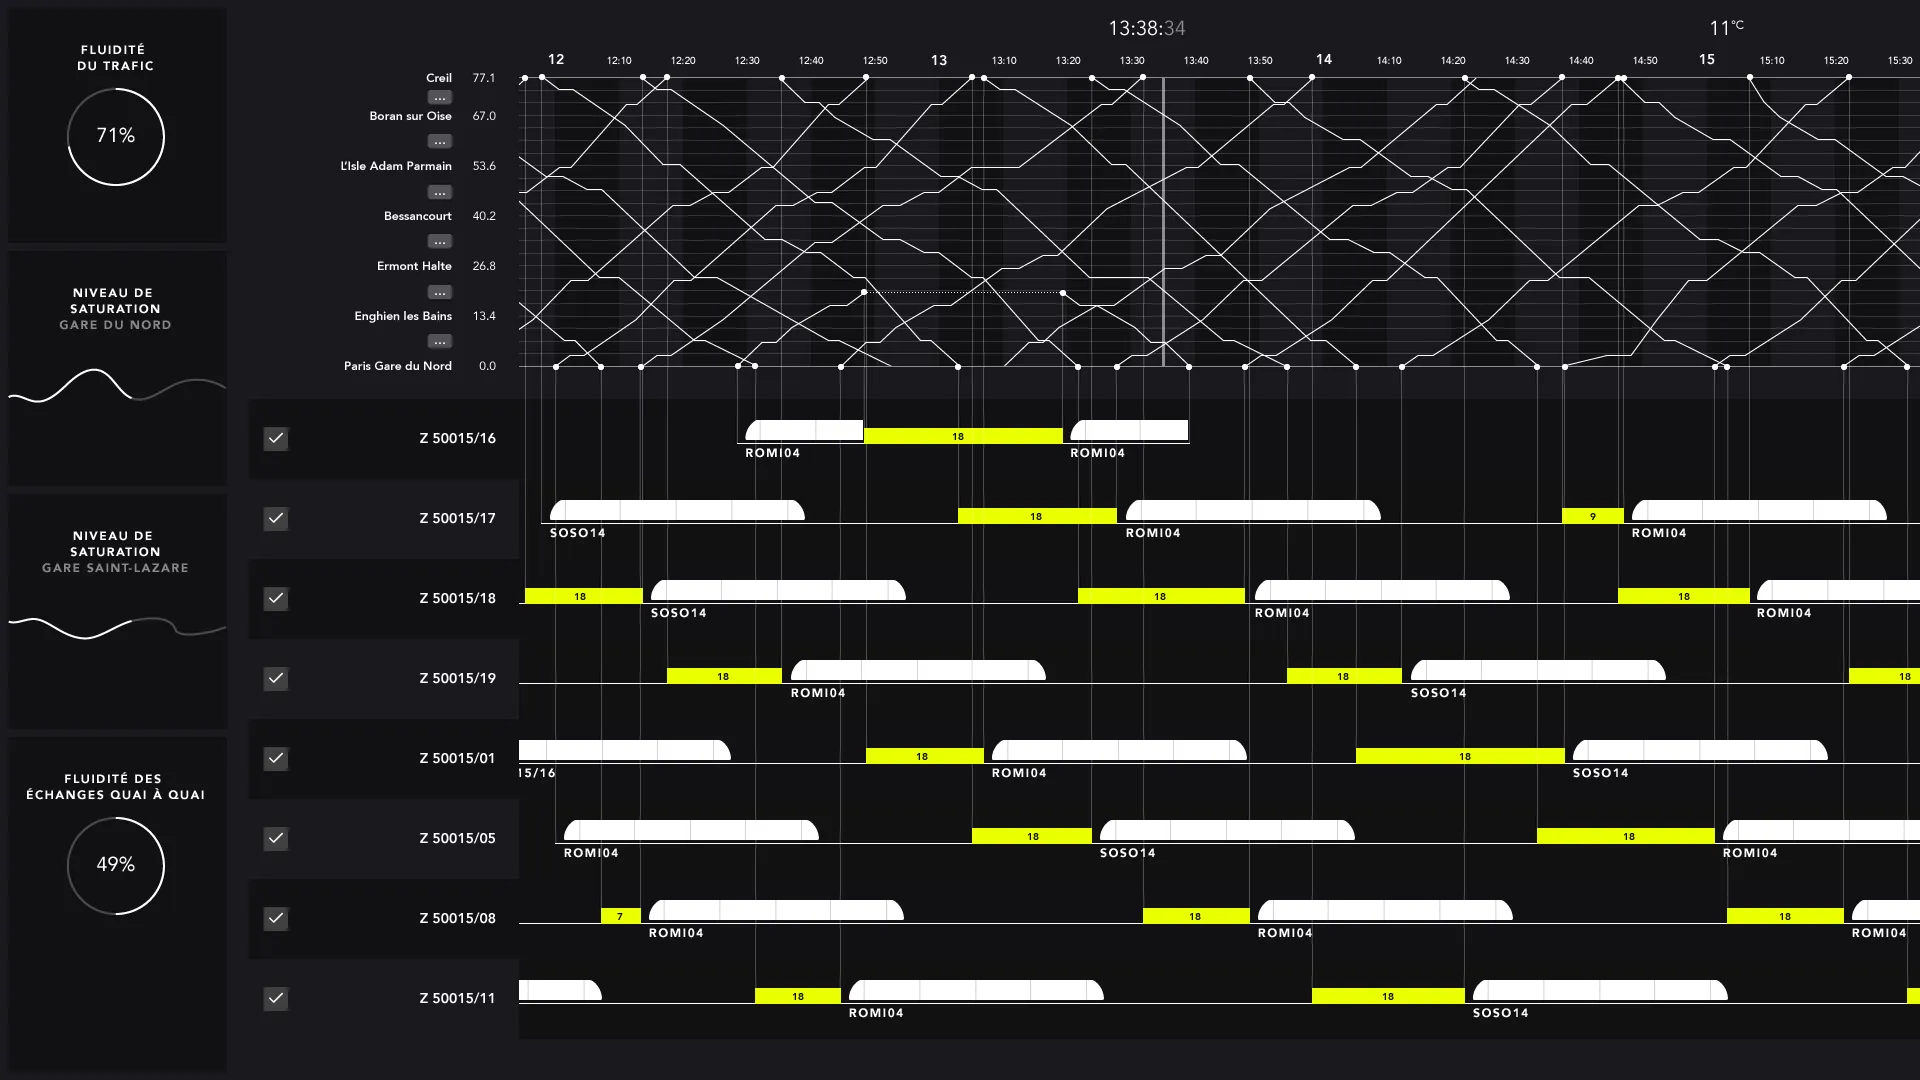
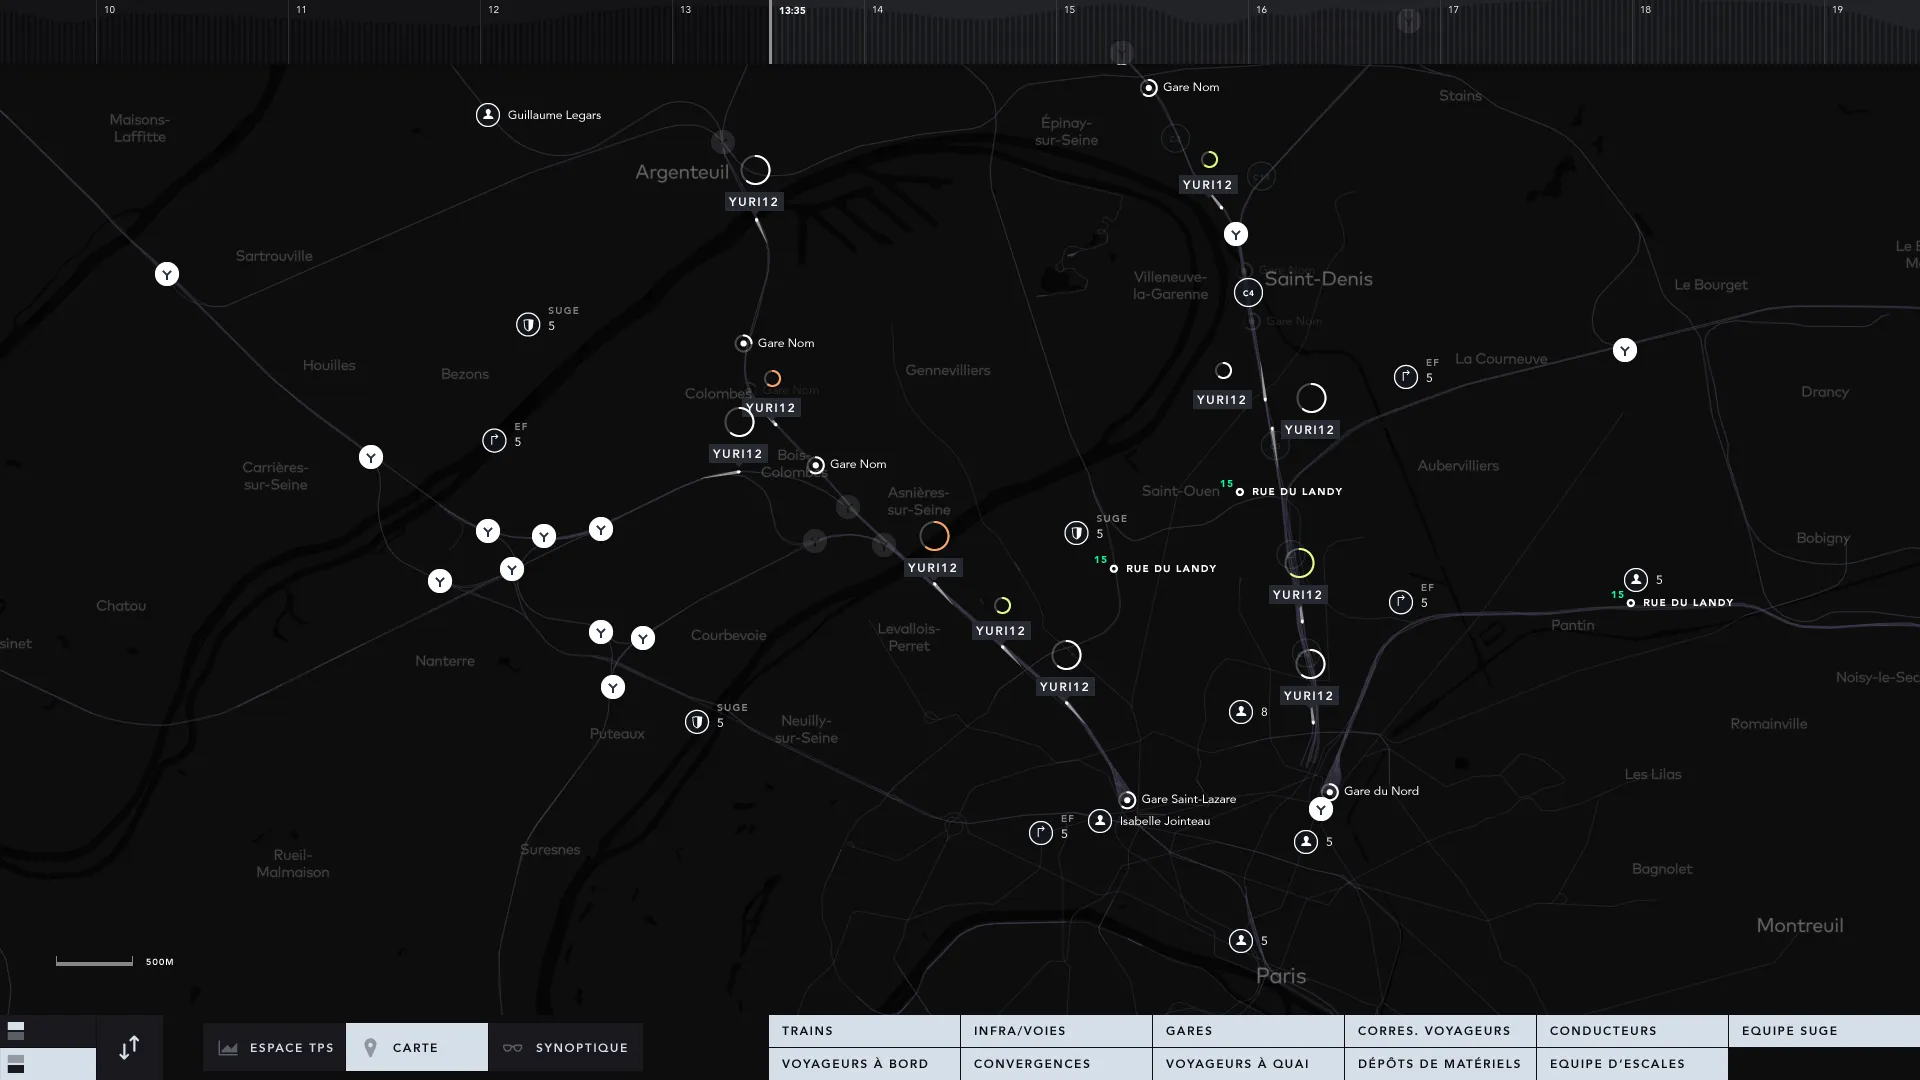
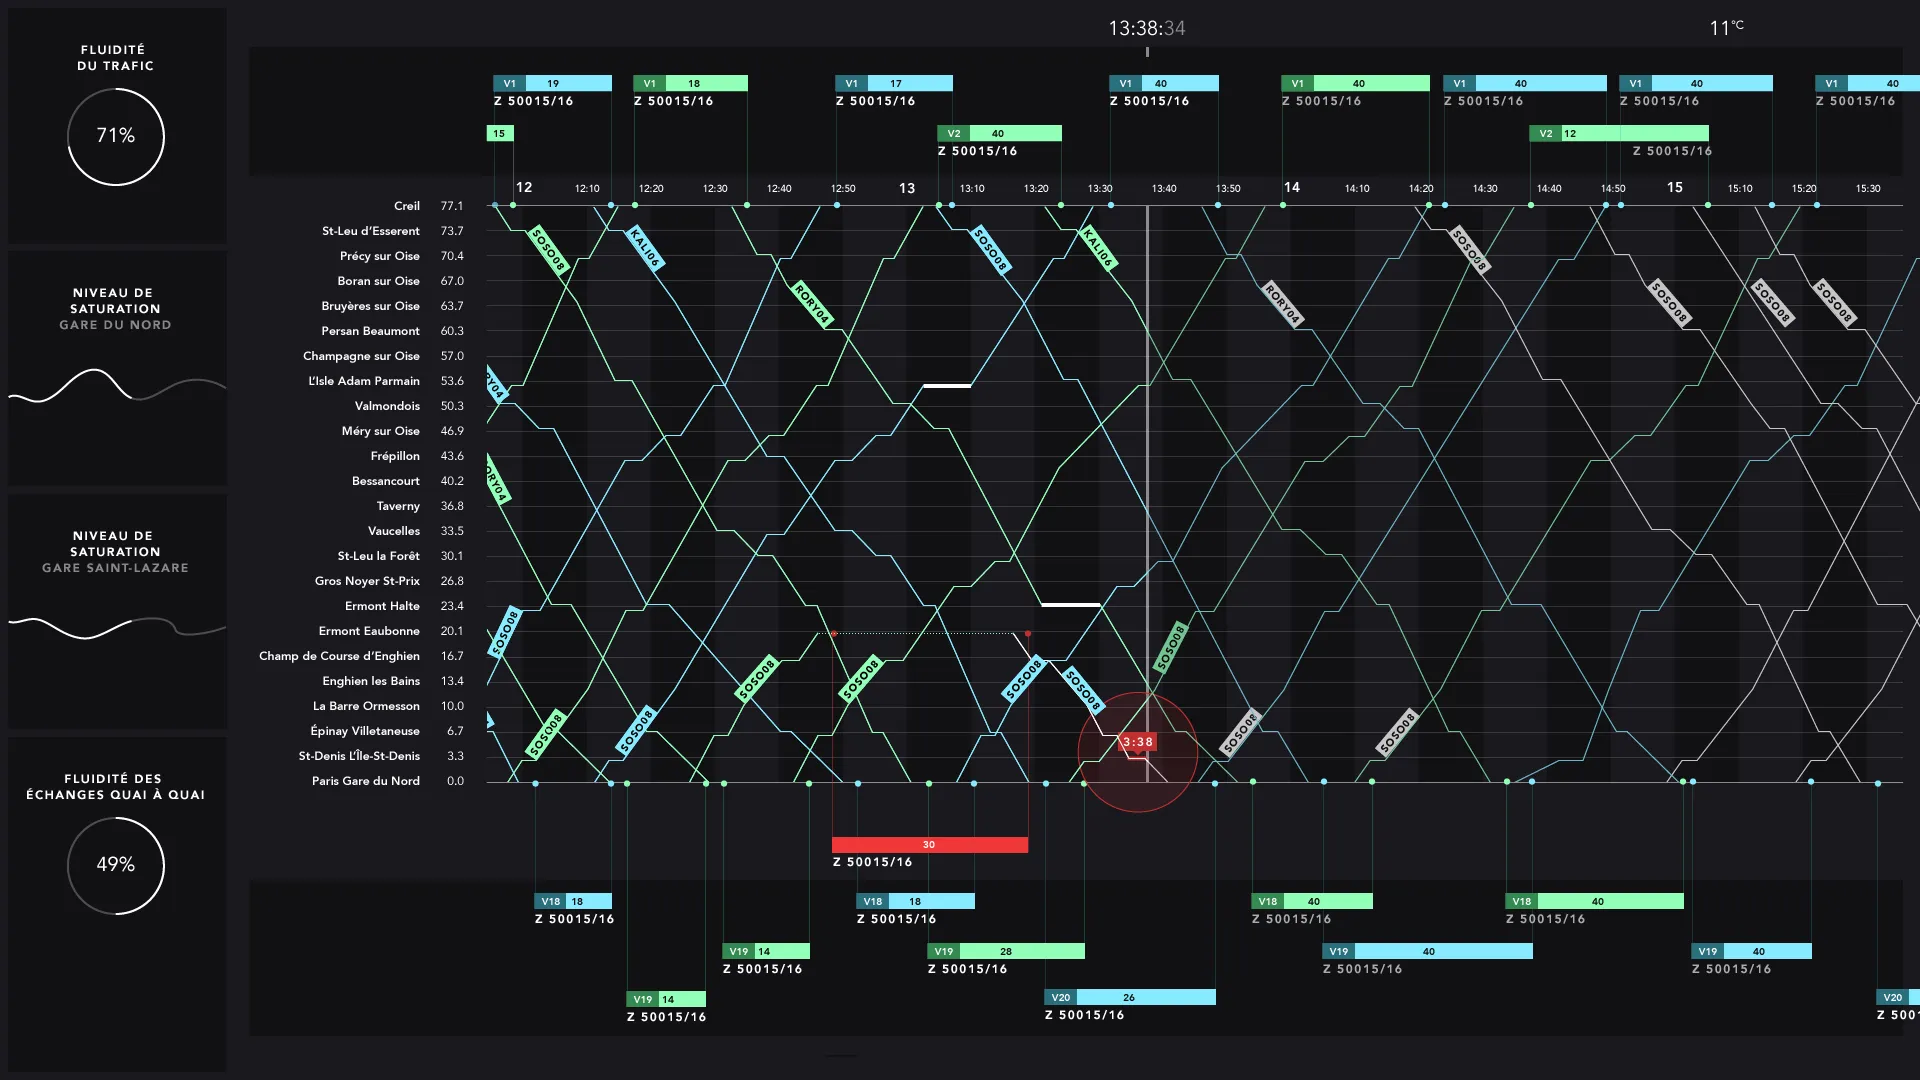
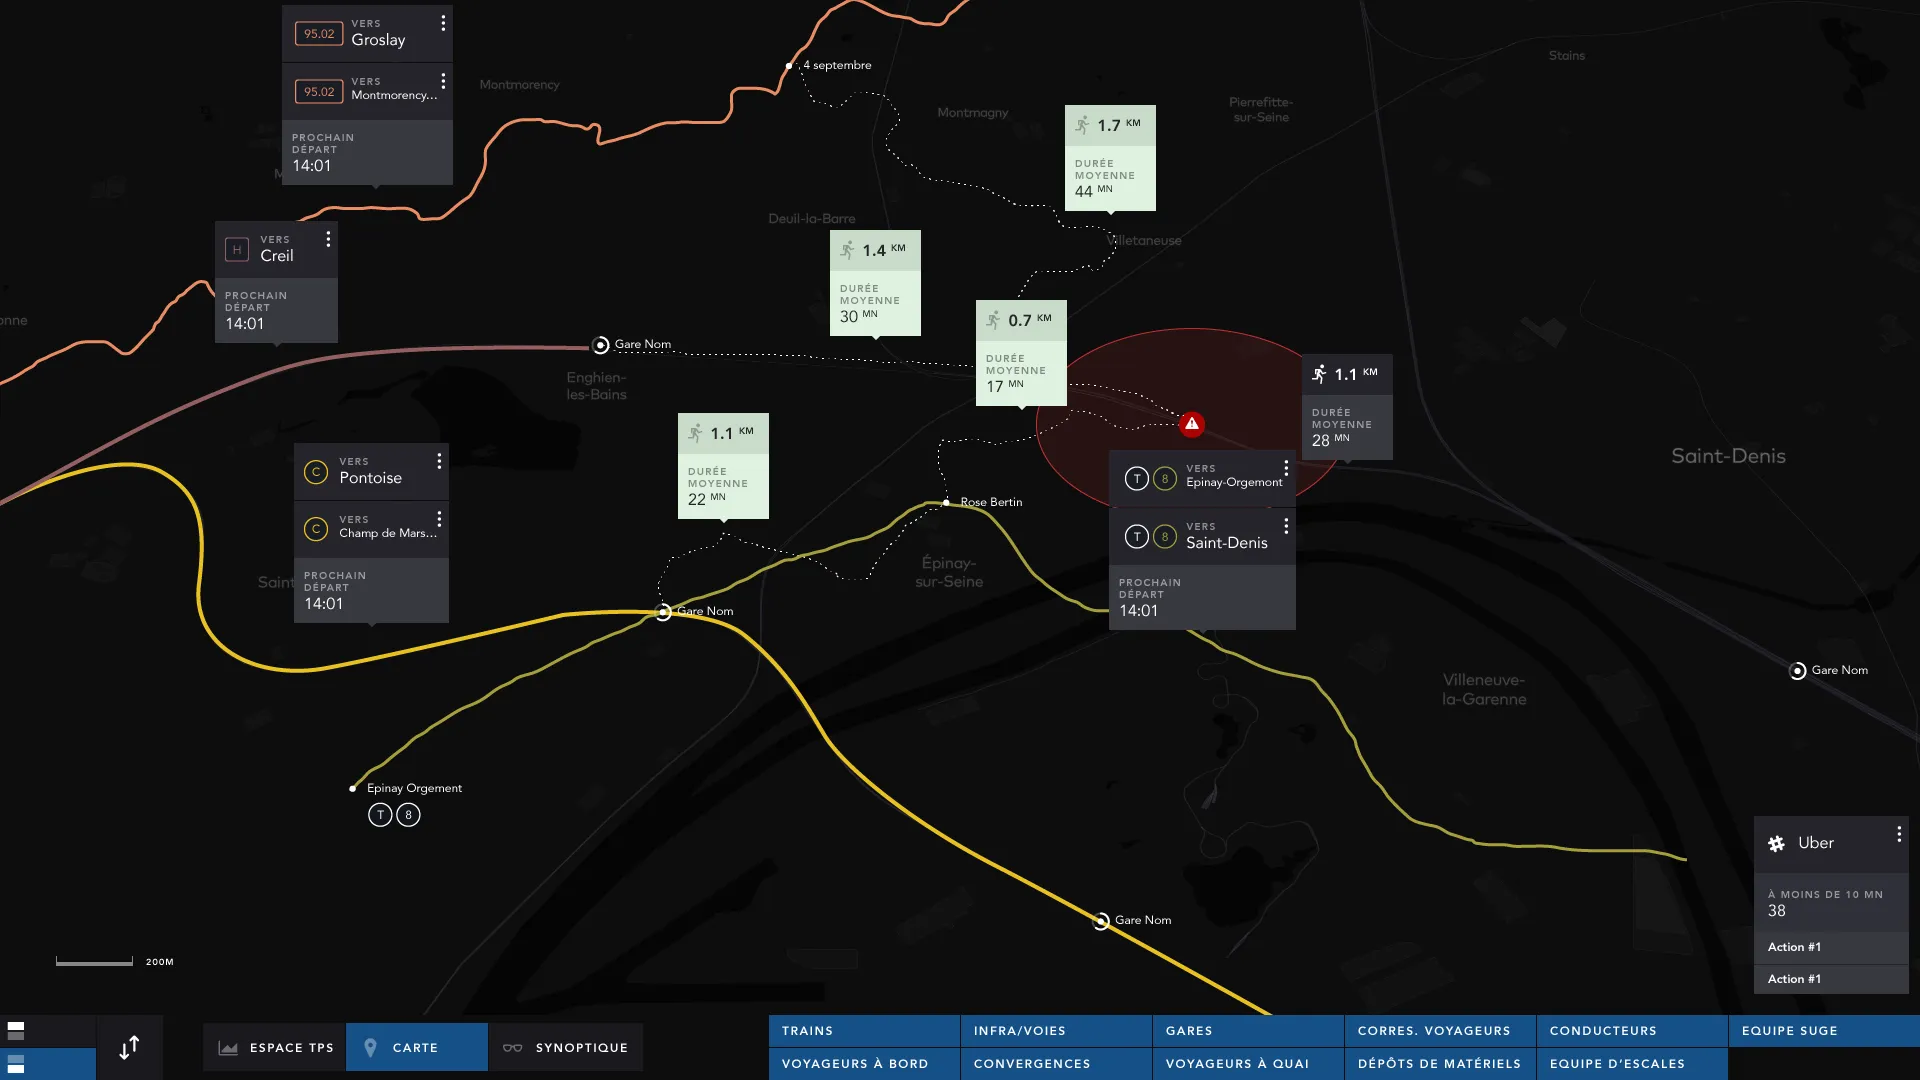
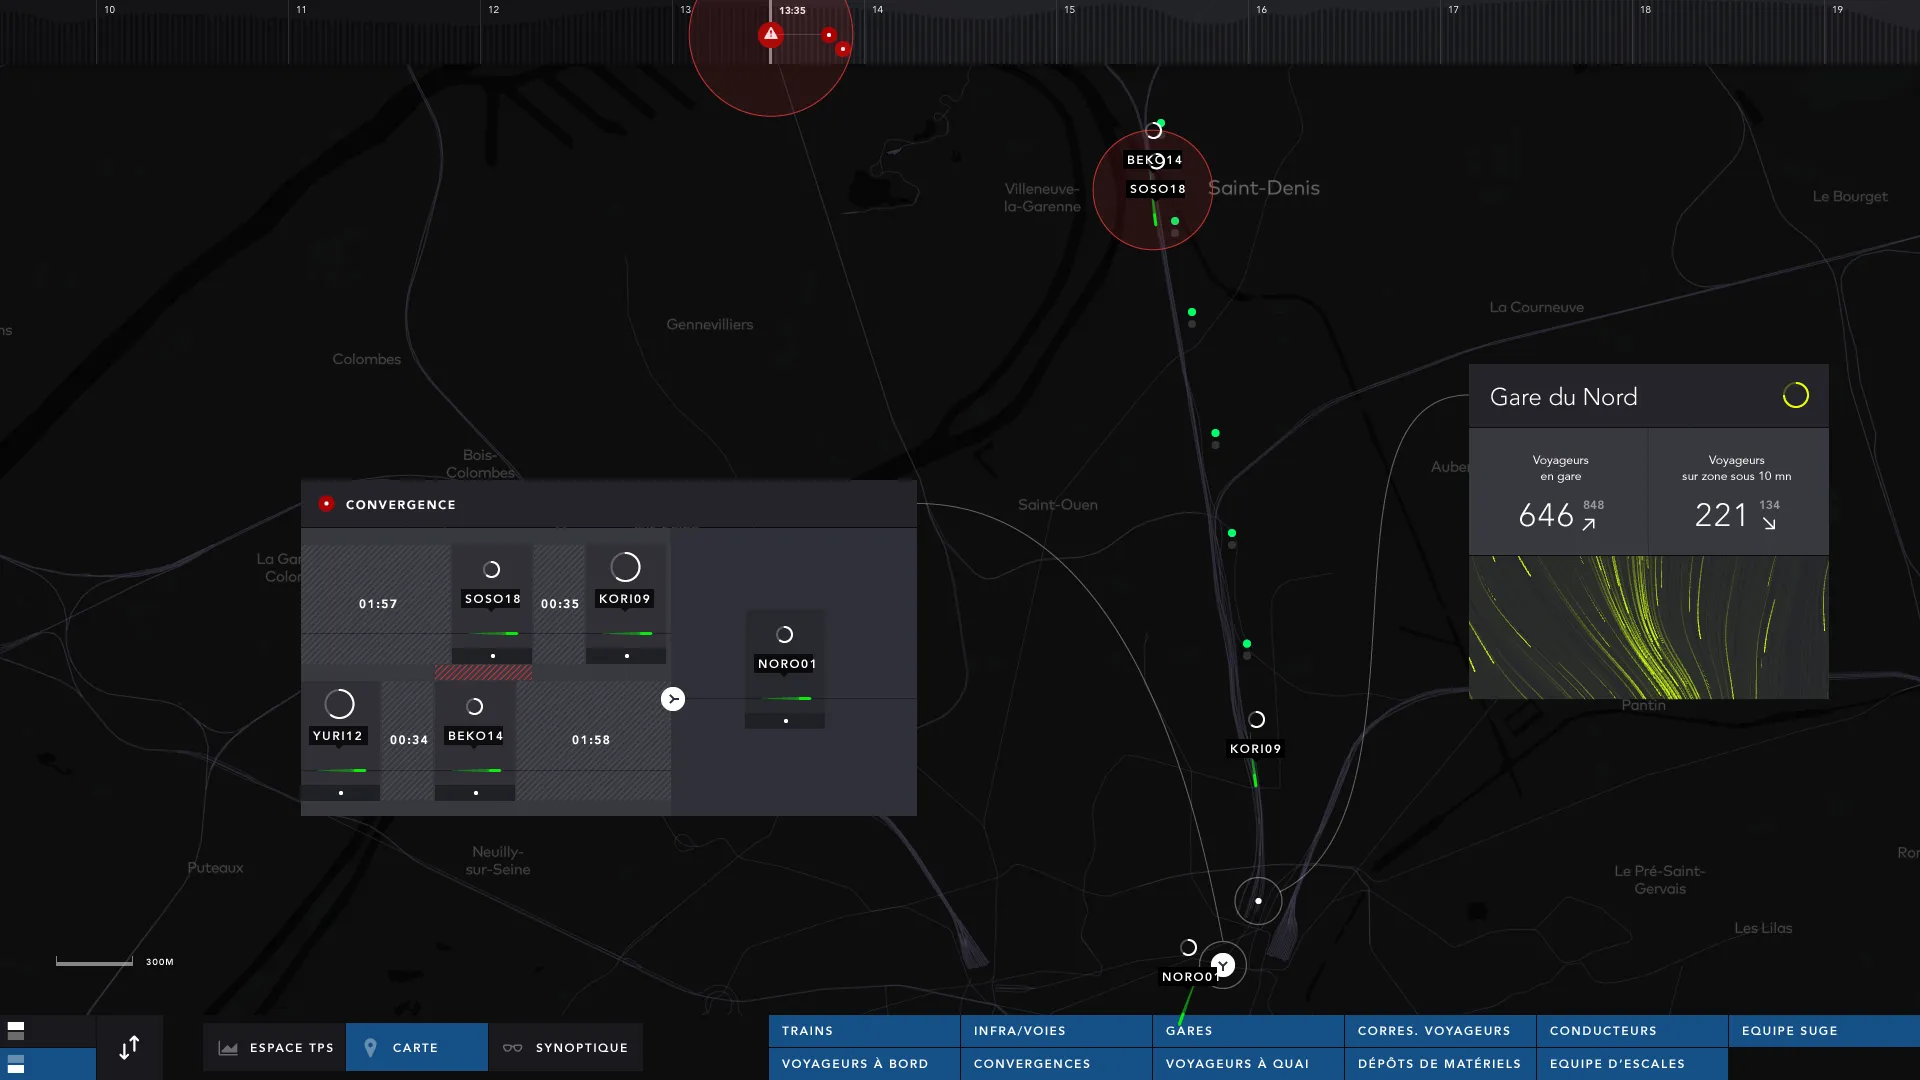
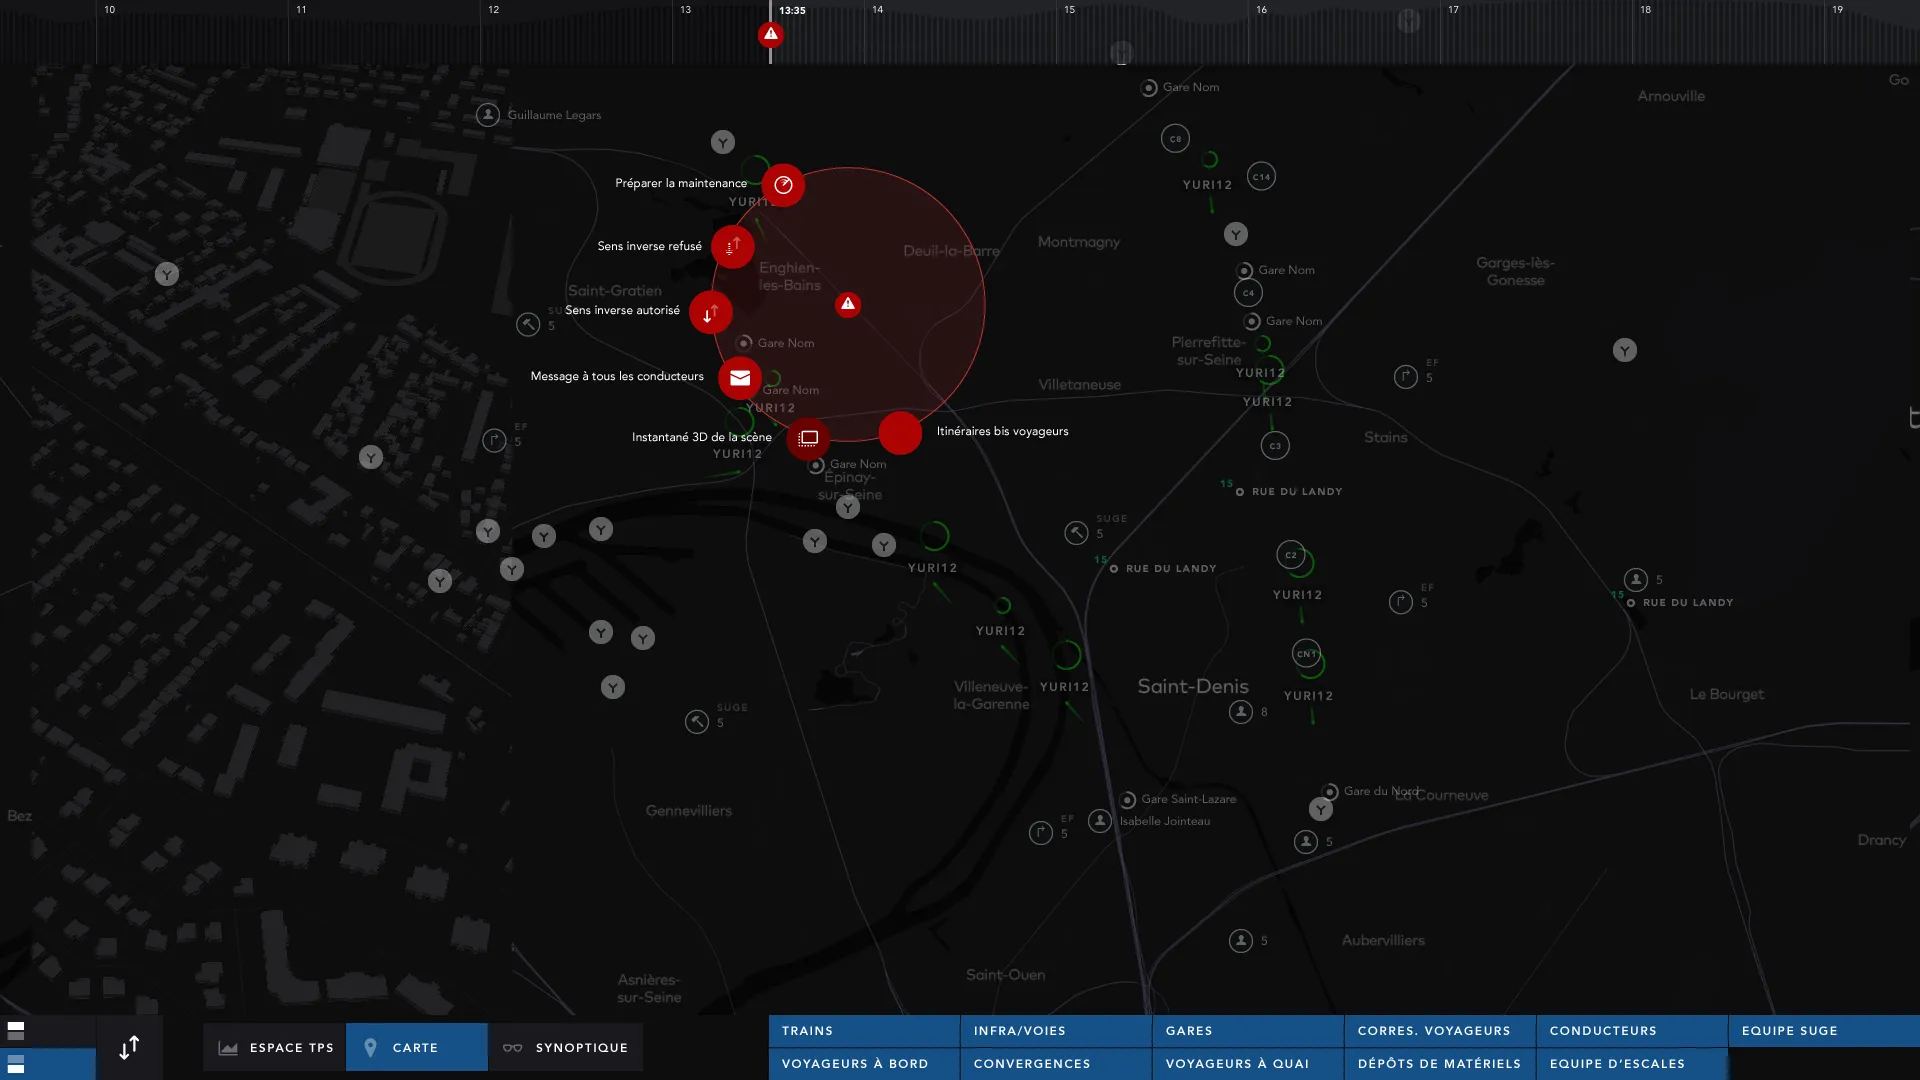
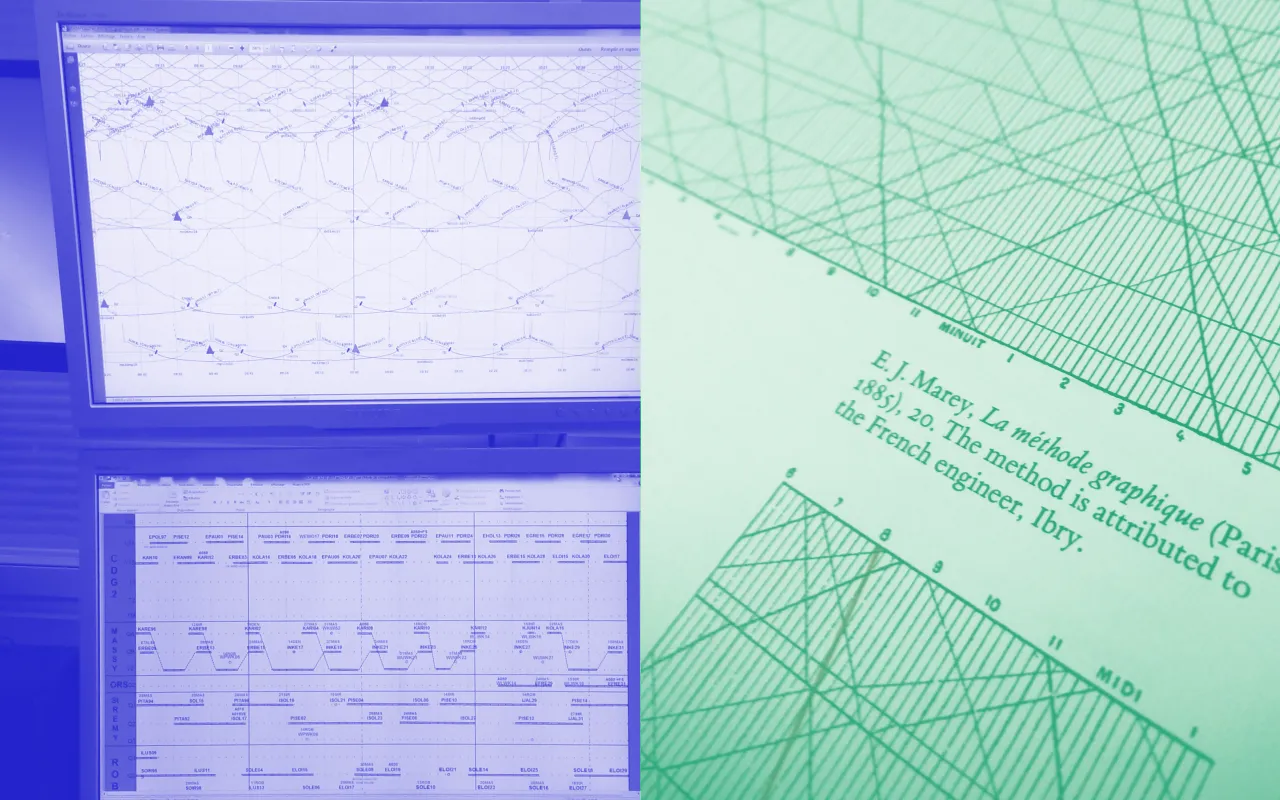
In addition to classic views like Galite, a detailed physical mapping (3D) is designed. We visualize tracks and stations, the track occupation graph, a network view.
Ergonomics and readability
The interface is clear and communicates (feedbacks). Despite the obviousness, it’s the poor relation of the operational tools observed in the field.
A modular interface
A complete tool would allow sharing a common vision while allowing adaptation to each business.
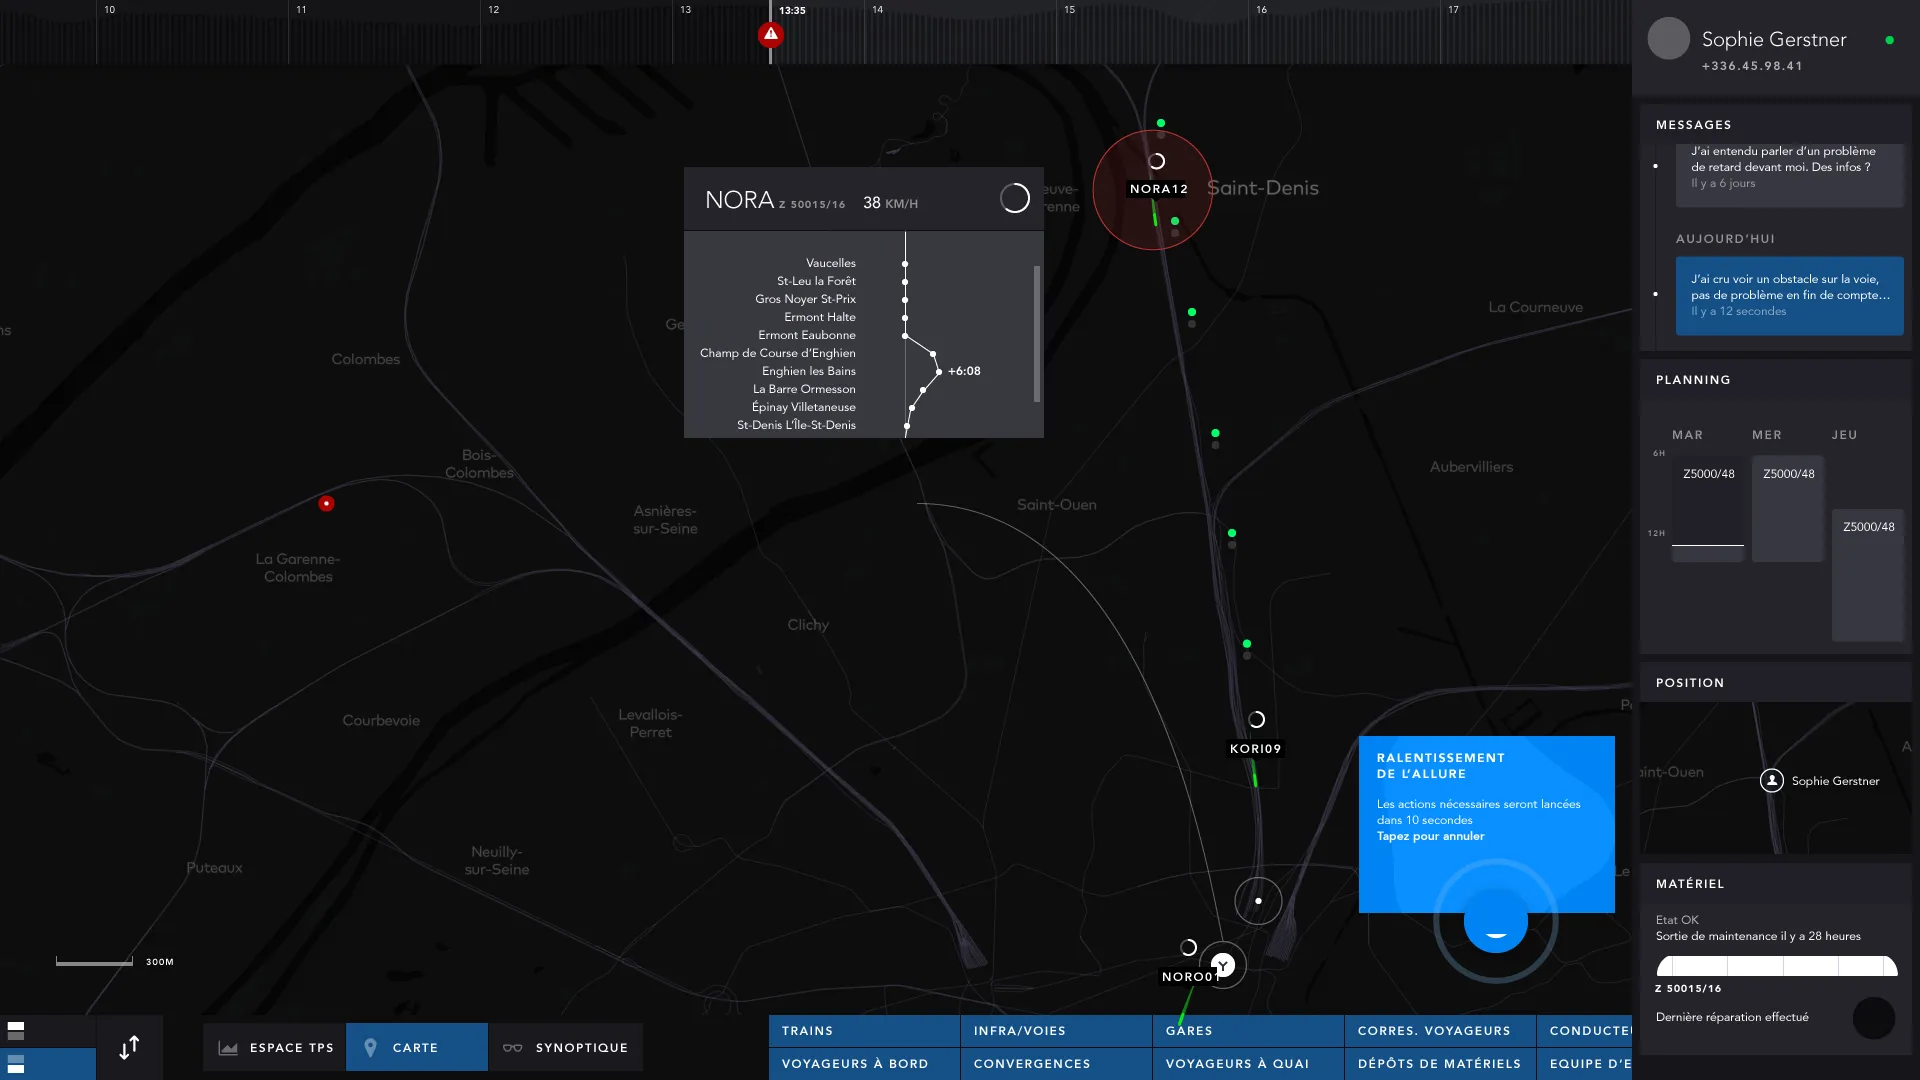
Navigating through time
This is a major element of the tool: its ability to “see” into the future to be able to anticipate and launch necessary actions in advance. The interface makes time t and time t+1, t+2, t+n readable.
Animations and gestures
Large amounts of information are made readable thanks to animation. Gestural interactions allow increasing productivity
AI participates in problem handling and processing
The AI agent offers recommendations, calculates different crisis exit levers, proposes action plans that help the supervisor in their decision-making. The challenge is to determine the intervention level of this agent.
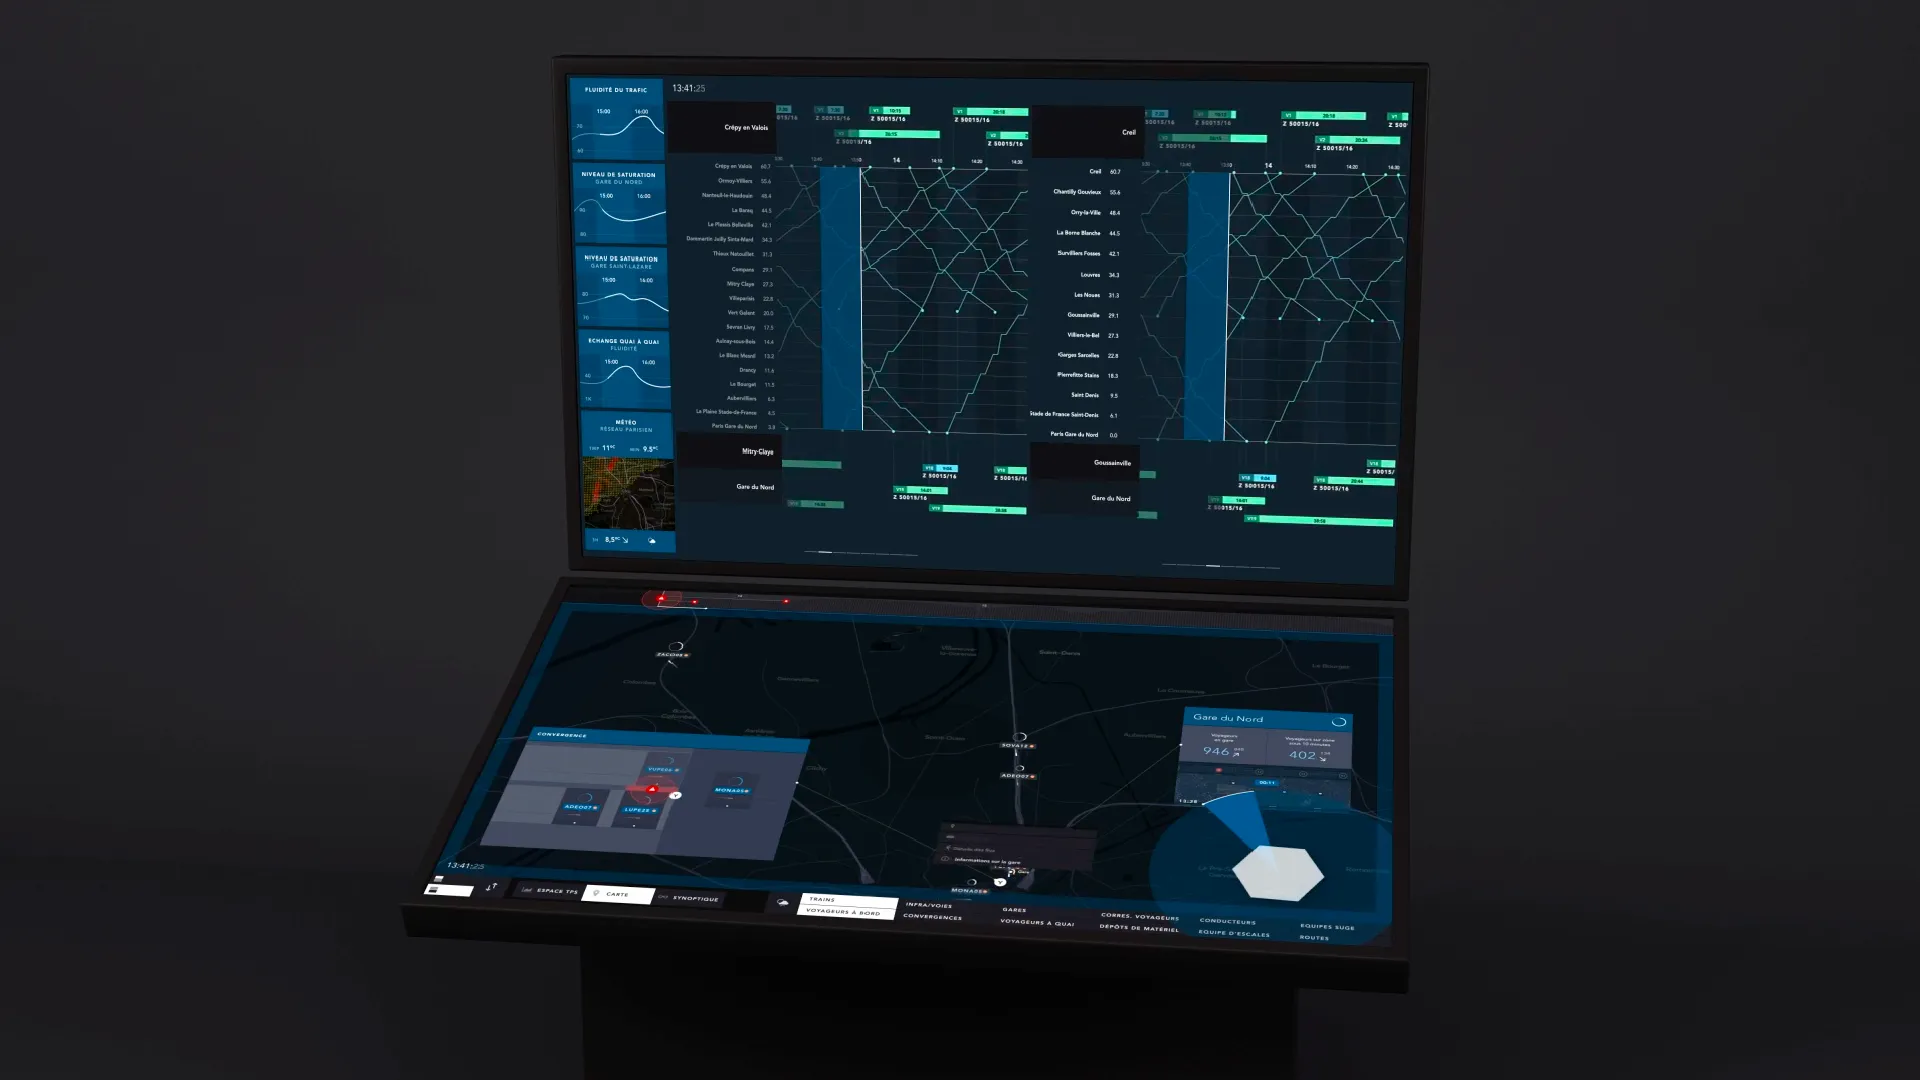
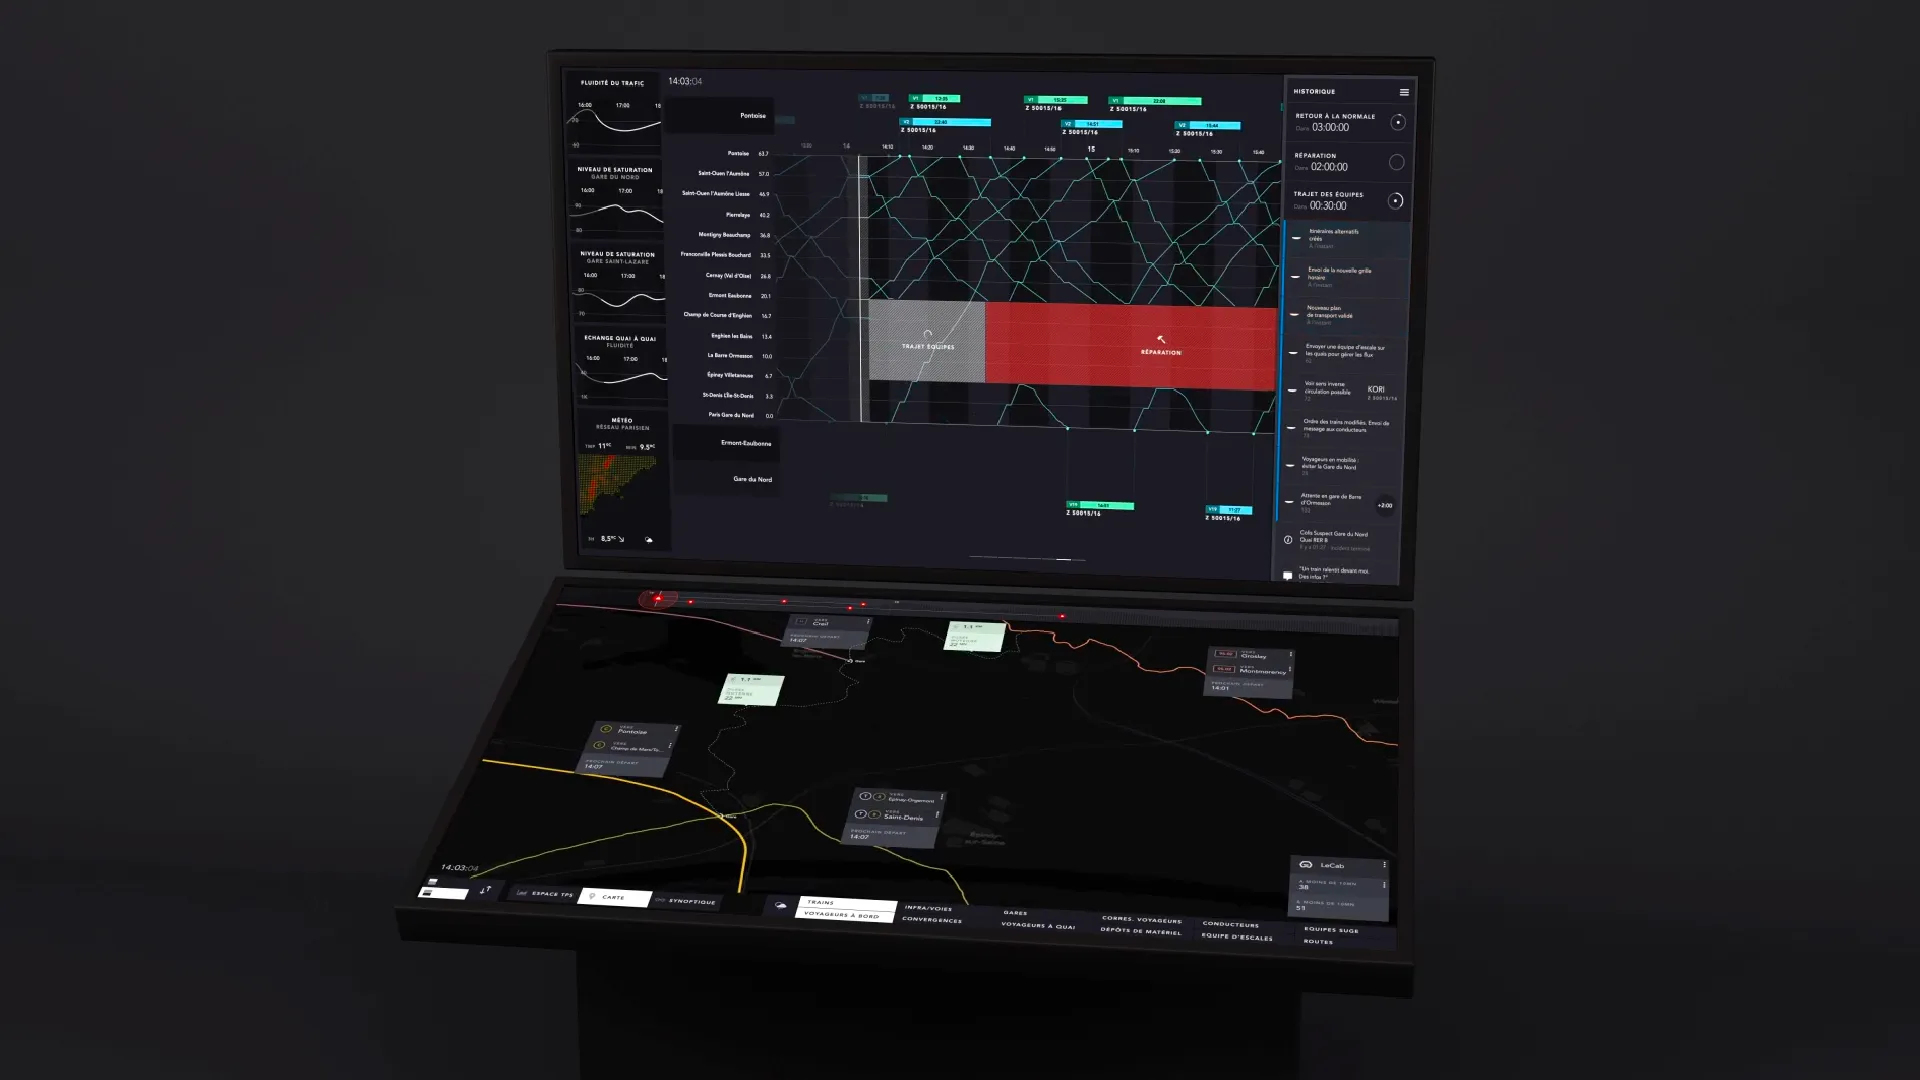
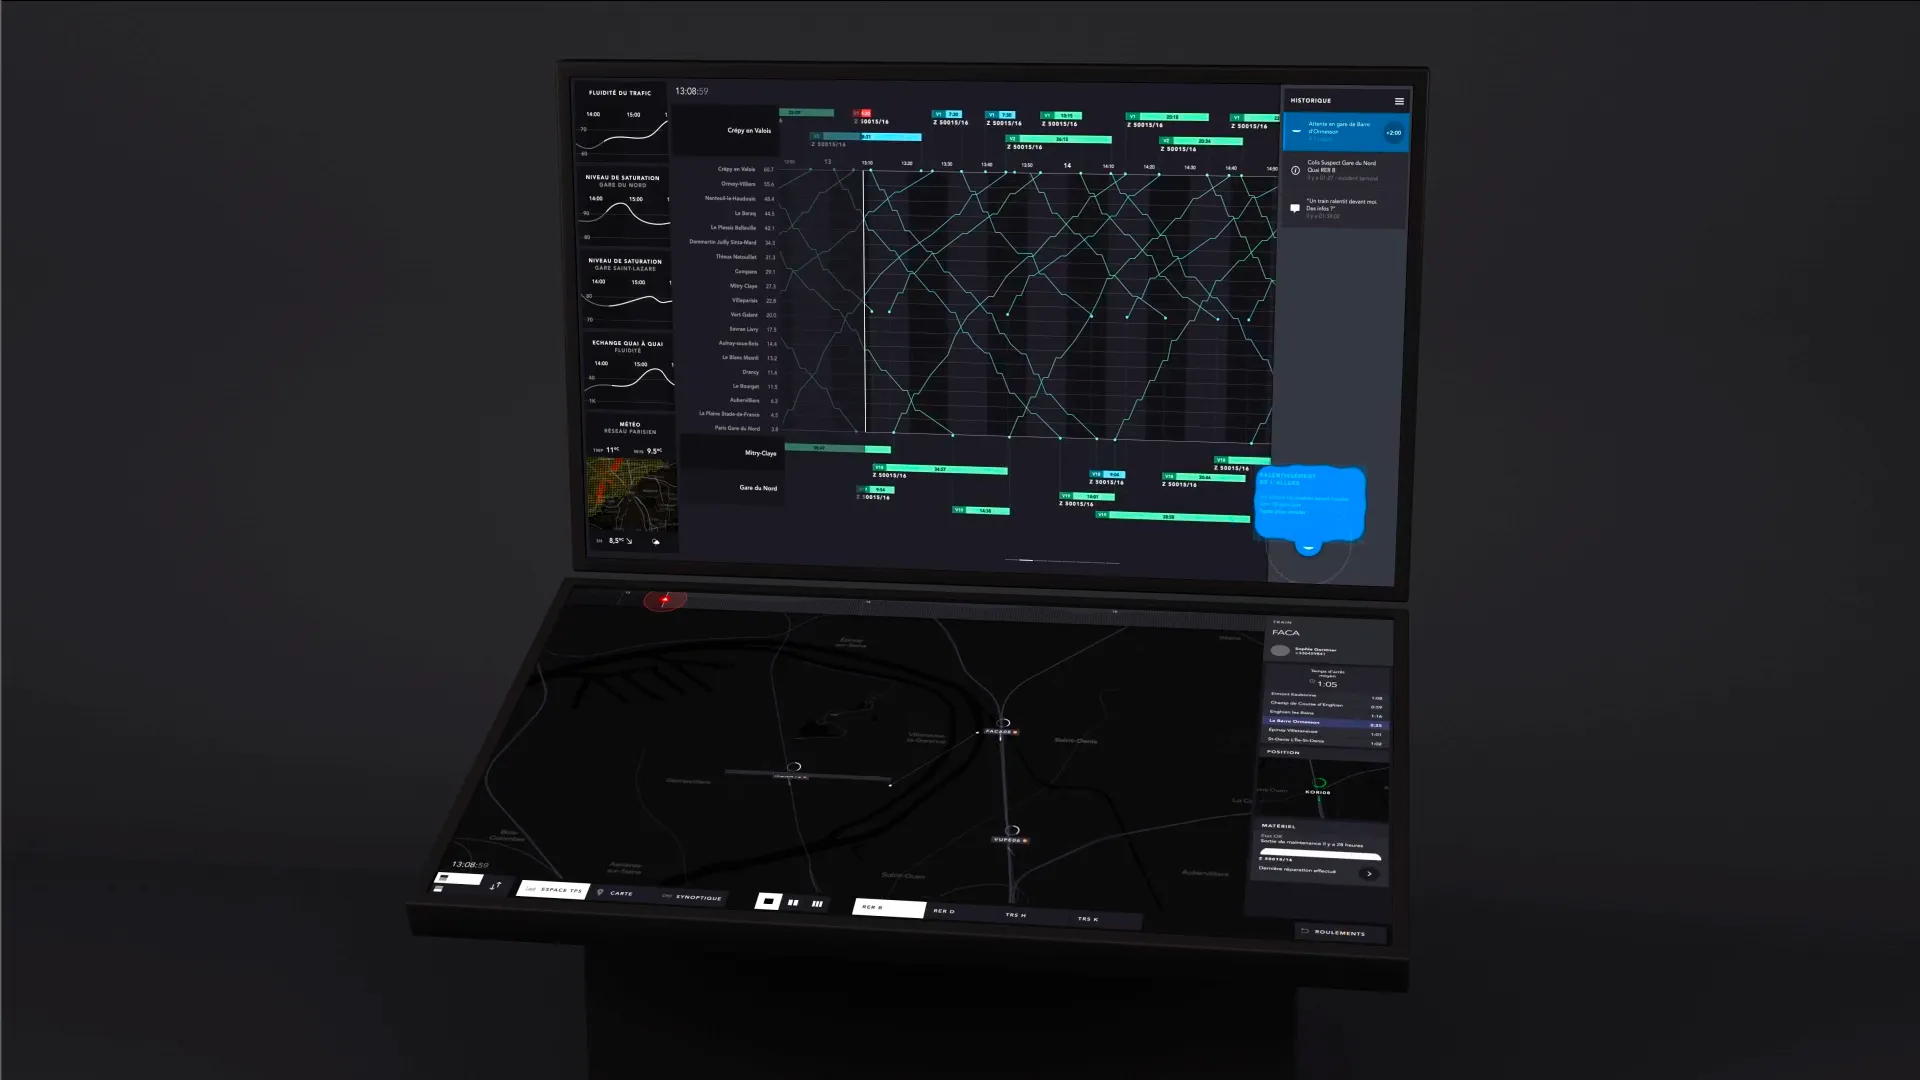
Final device
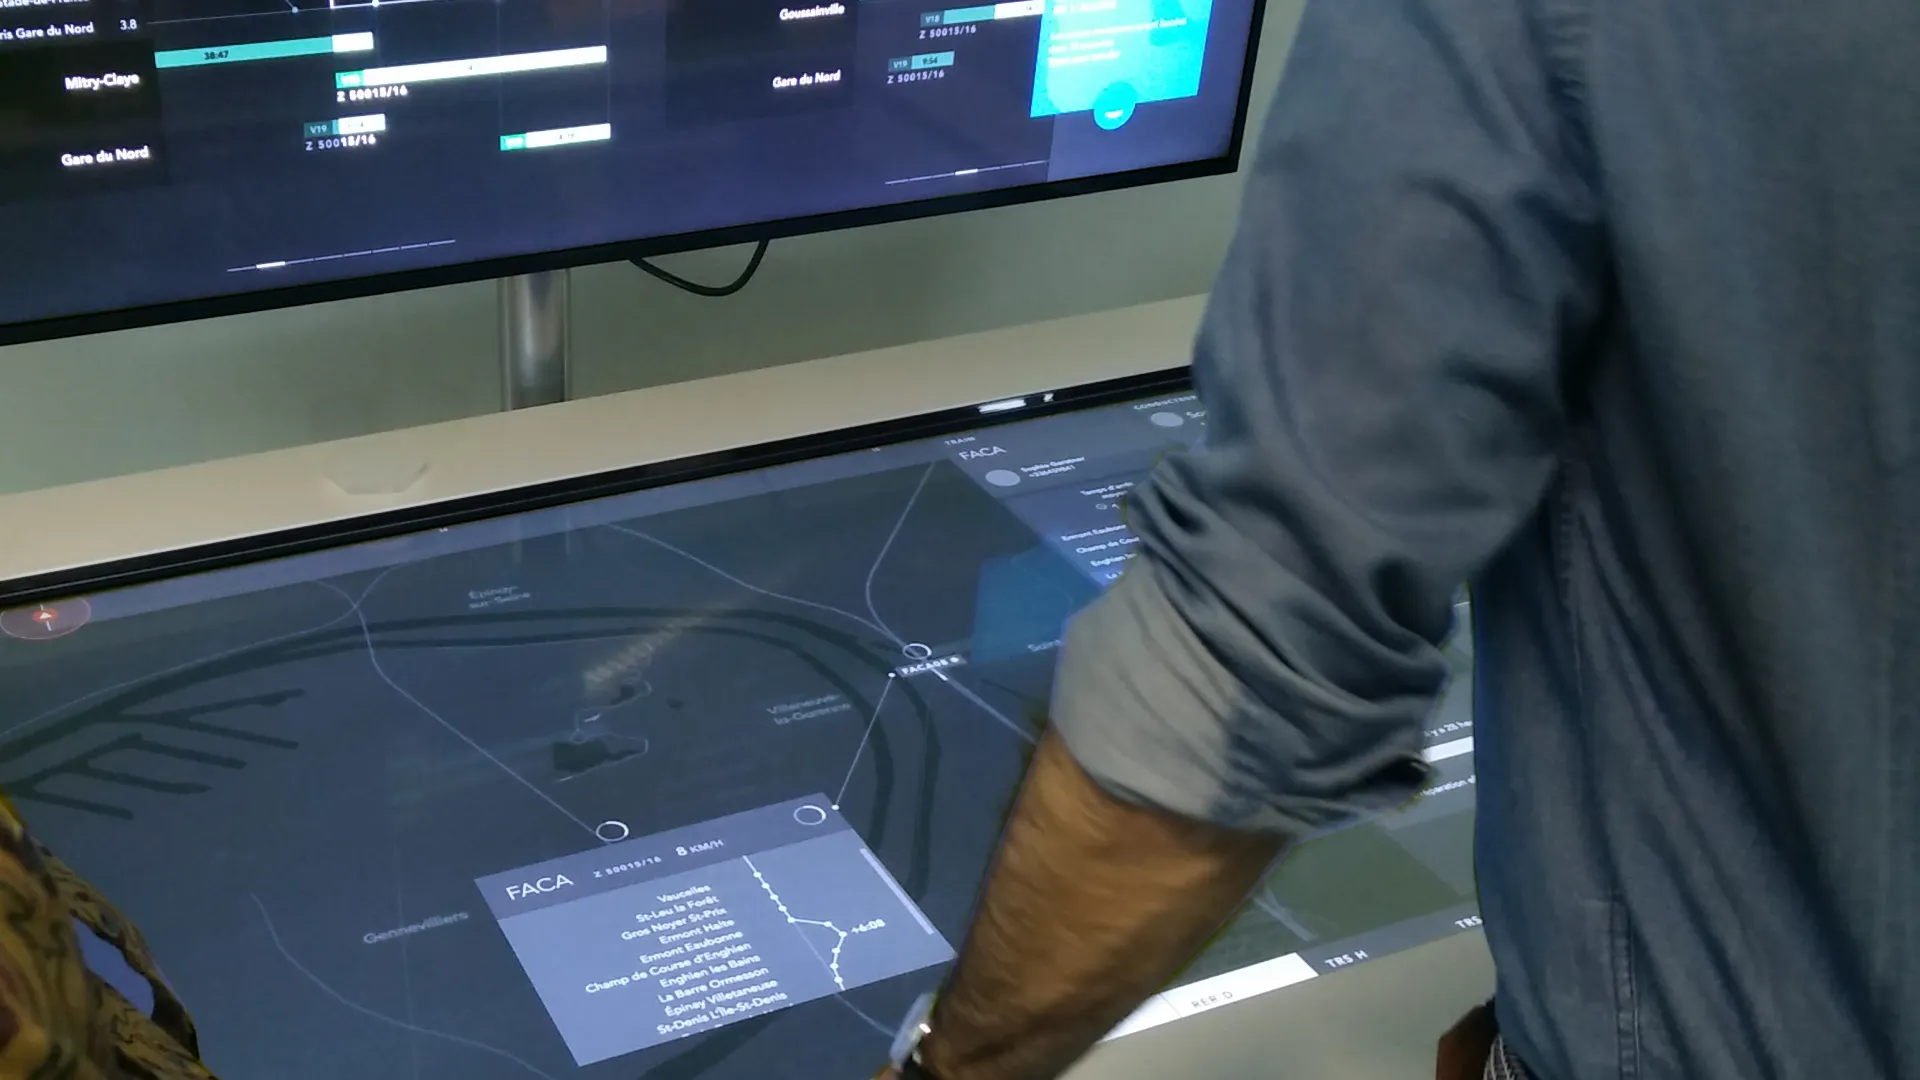
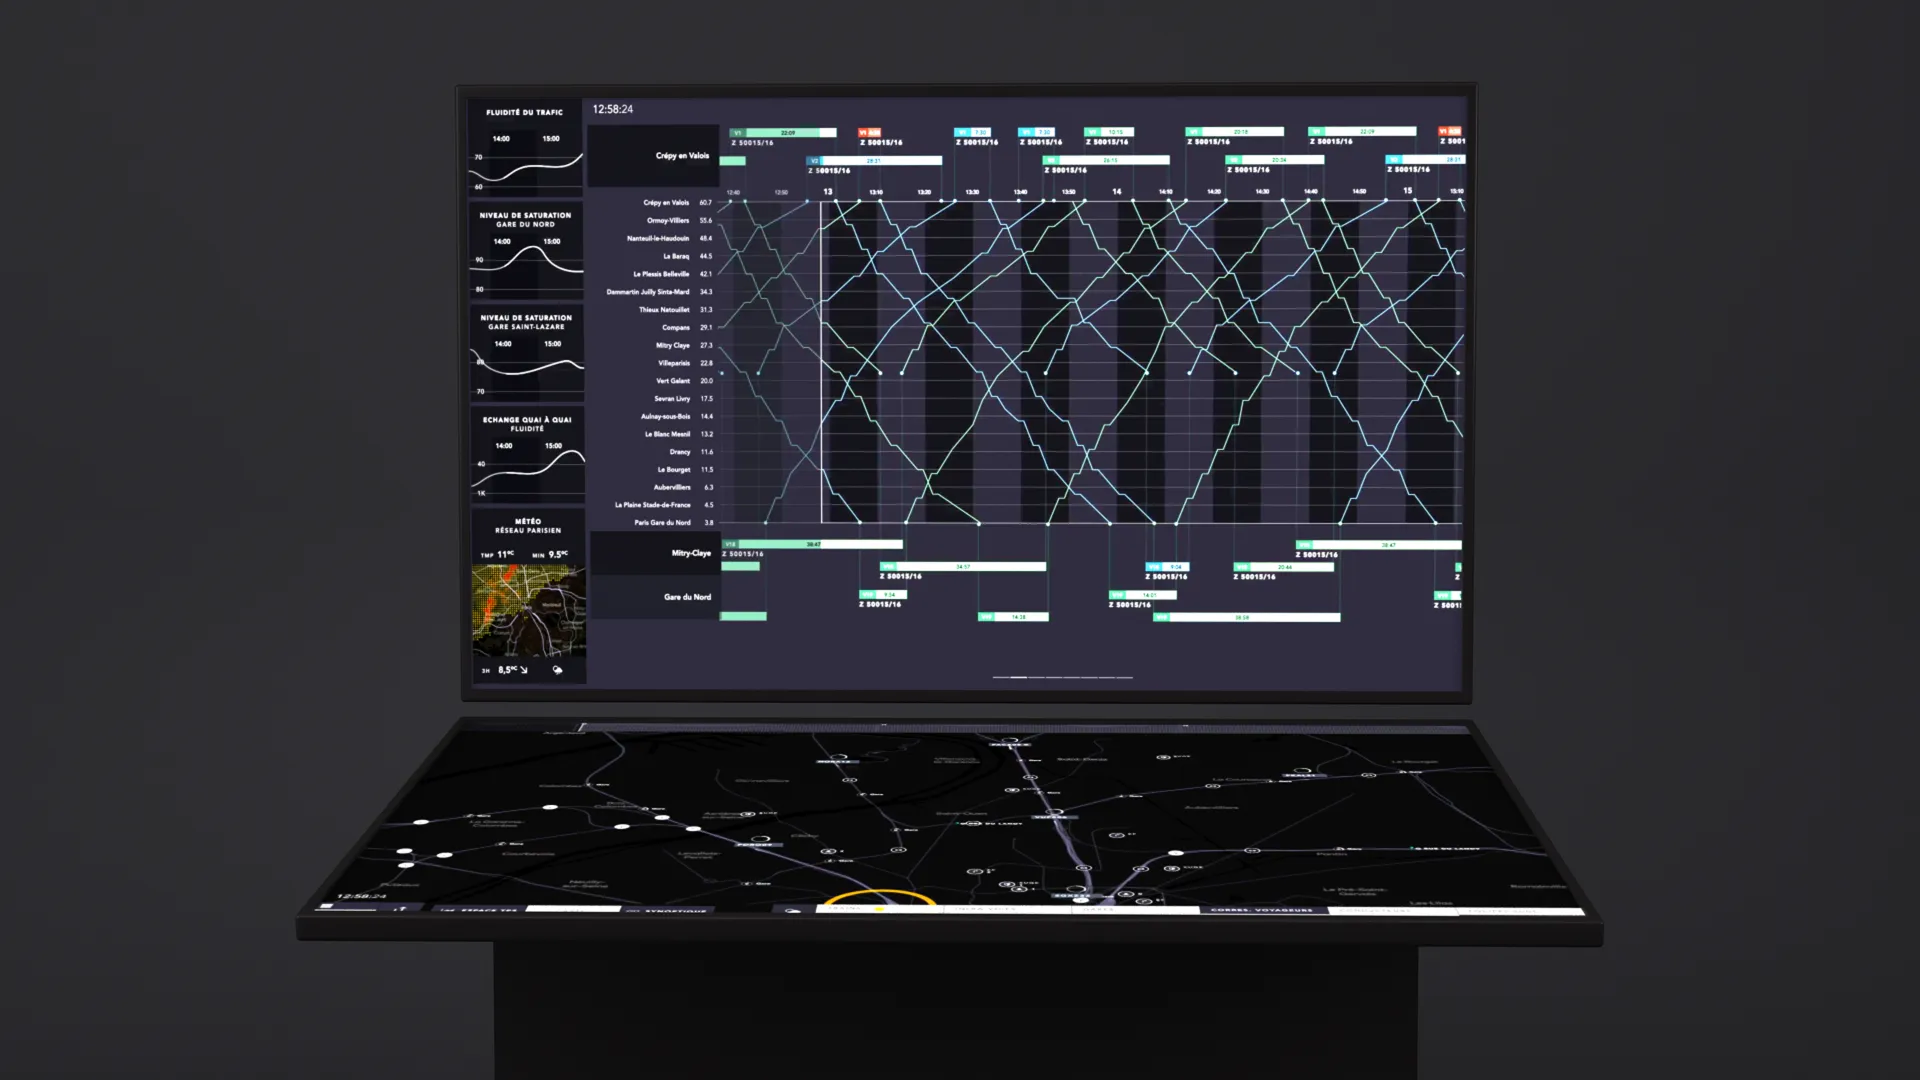
The fruit of these few weeks of work is a film made on a dedicated device. The device consists of two 68cm diagonal screens, Resolution 1920*1080. A horizontal touch screen, and a vertical display screen. The horizontal touch screen also allows using physical objects, placed on the interface.
This two-part device allows splitting usage: see and do. The vertical part allows visualizing network state, while the horizontal, touch part allows interacting with the system.
We kept the best of existing visualizations from supervision centers, and enhanced them with capabilities specific to recent equipment, with touch capabilities in particular. No revolutionary interactions, or cognitive upheaval on the horizon for users.
Innovation rarely lies in a new, radical proposal, potentially disorienting for the user. That’s why we chose to attach ourselves to certain tools, and to certain existing visualizations.