Supervising a data center
13/01/2025 - 3 min. de lecture
Command-line tools are powerful, highly customizable, and provide access to a considerable amount of information, manipulable with keyboard alone. They allow the user total control and access to great depth of information.
The technicians to whom the product presented here is addressed, on which I worked with Use Design in 2022, are accustomed to these command-line tools. Our objective is to increase the quality of information and improve decision-making by offering these users what the command line does not offer: A synthesis and consolidation of information, through a business prism or a technical prism.
Presentation
The application takes place in a device installed in airspace surveillance centers. Most of the information consulted there is provided by radars, scattered across a territory. Upon arriving in data centers, then in operational rooms, this data is processed by a large number of applications. Our objective is to provide a tool that improves the supervision of this application infrastructure.
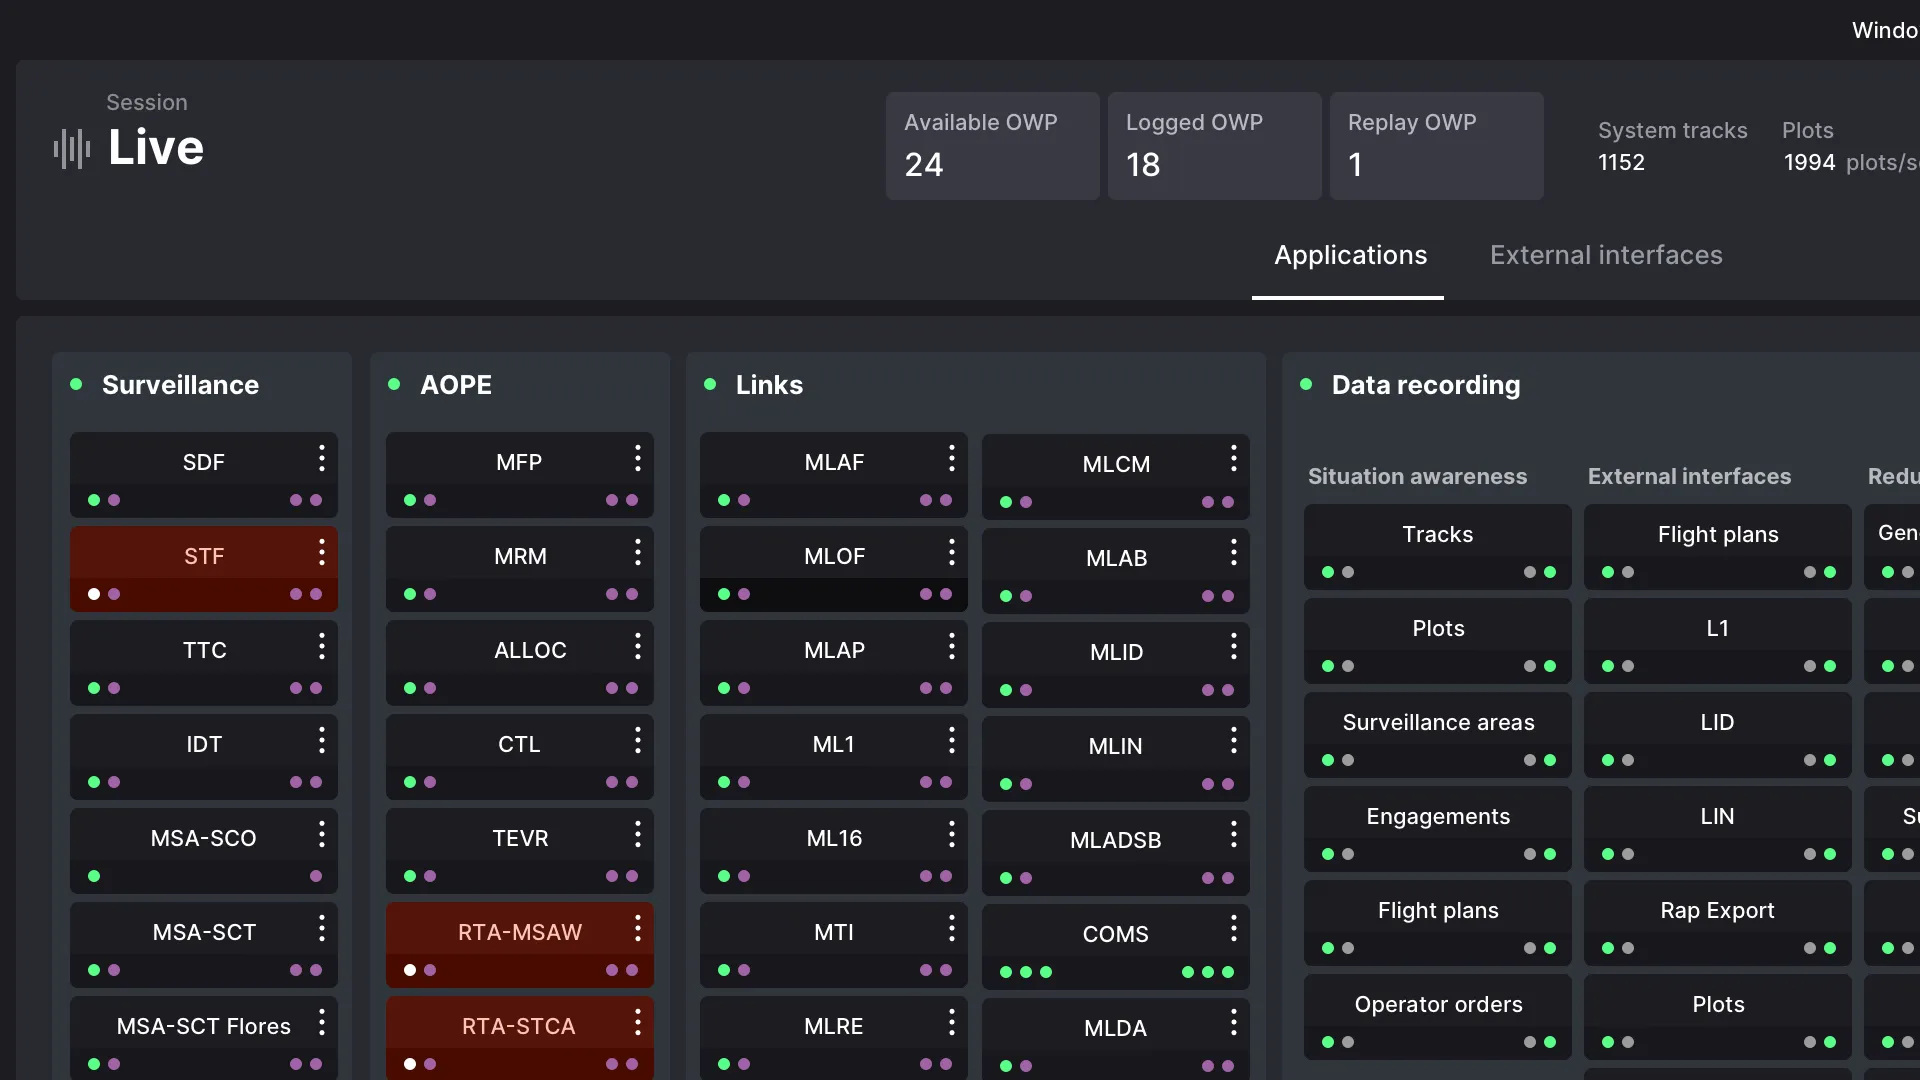
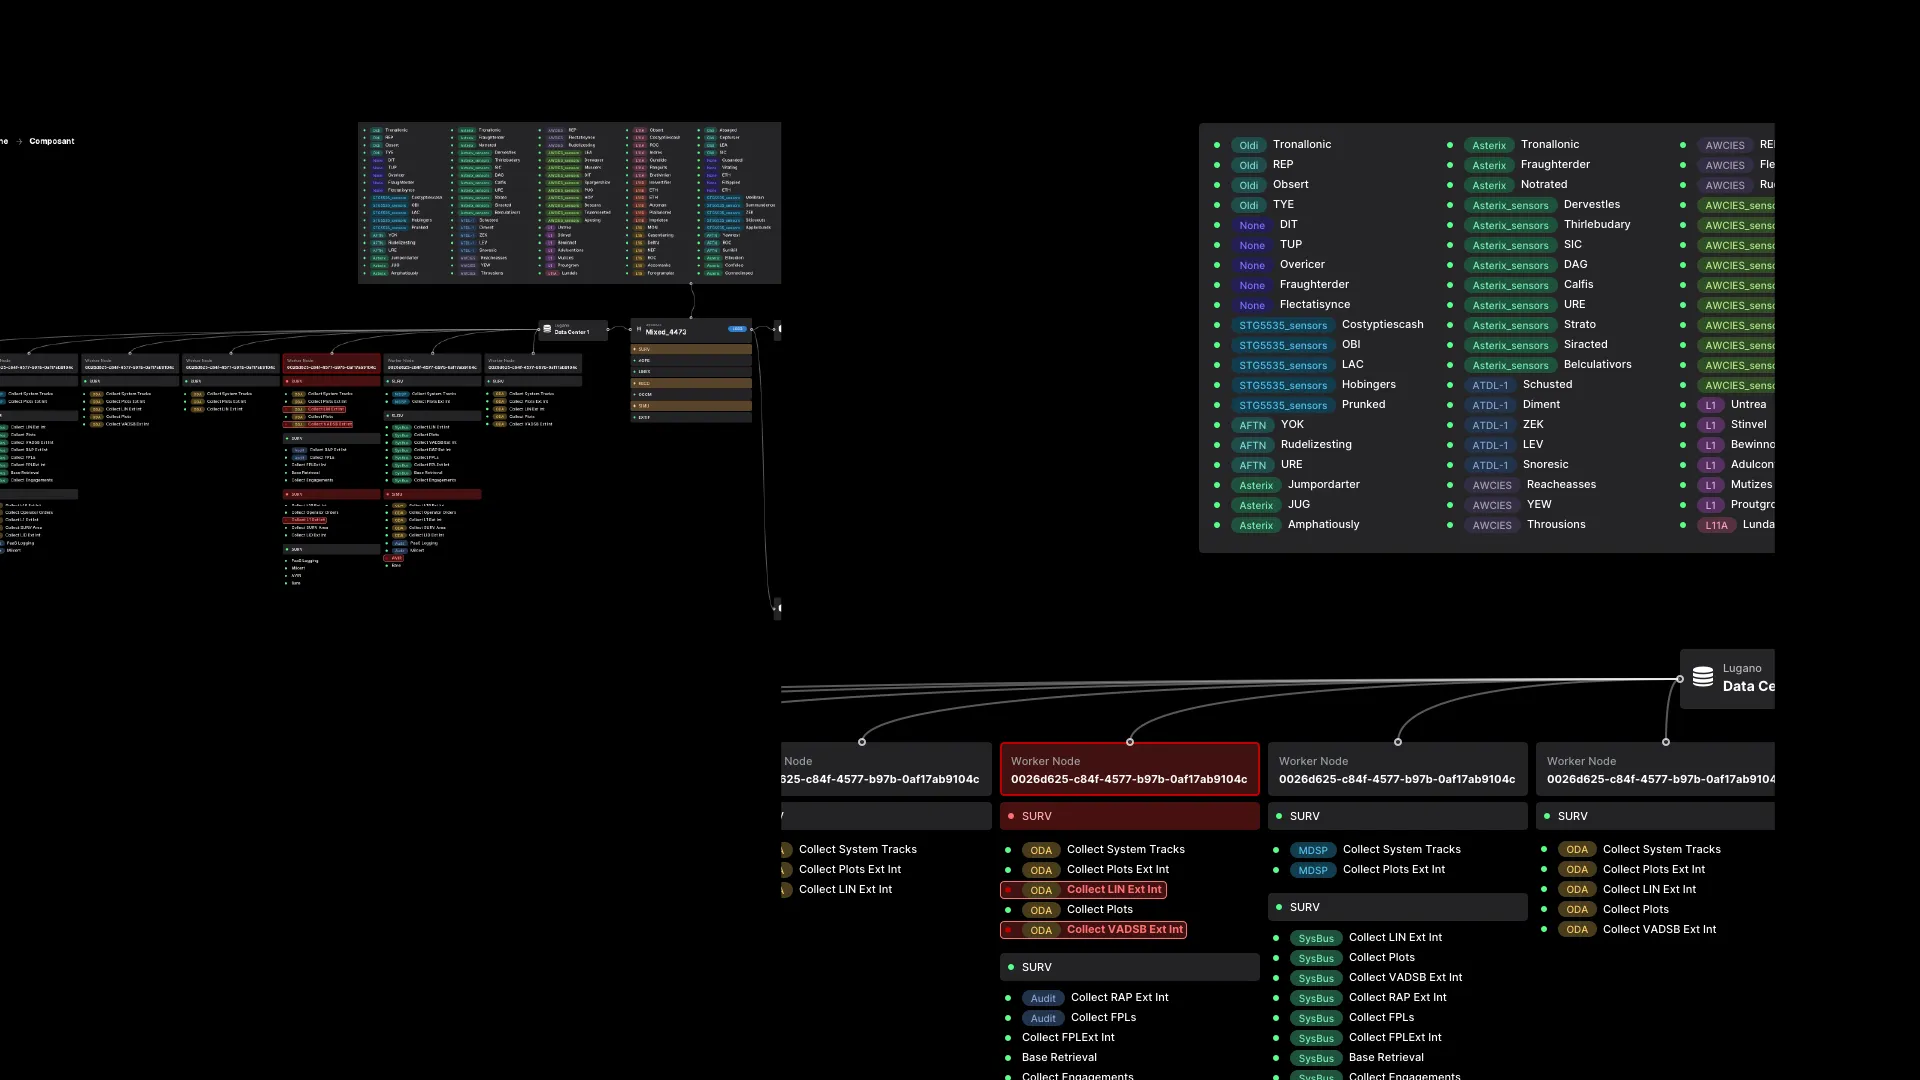
At the heart of the existing technical infrastructure, there are therefore two main types of objects: external interfaces, which create data (radars), and applications, with different levels of replication, which allow it to be exploited. Around these objects gravitate others: data centers and operational centers, machines that allow consulting the data. Data is accessible within sessions, which are training sessions or live sessions.
We can see: the system involves physical objects (servers, radars, work rooms, connections, workstations) and virtual ones (sessions, executables). The interface will allow supervising all of these objects, of different natures, and will offer a consolidated view of this state.
A critical case: data flooding
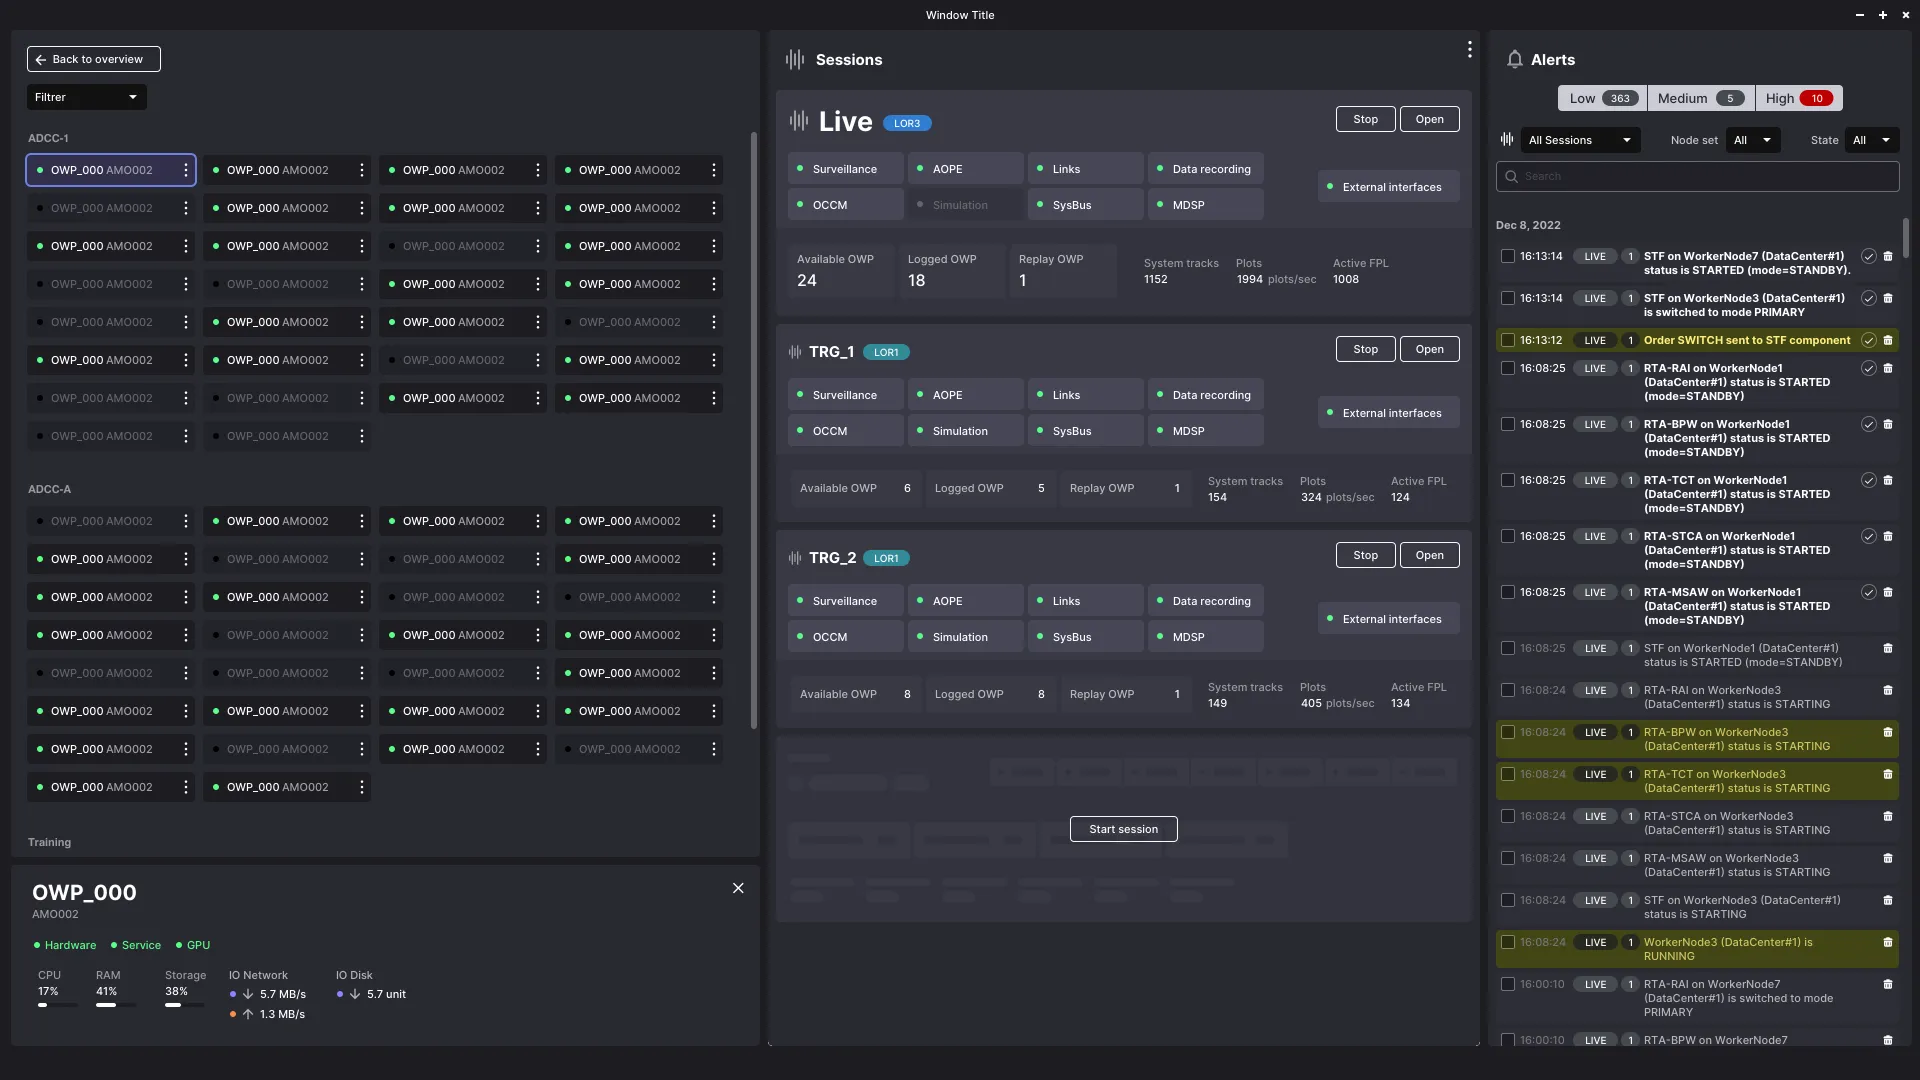
Data flooding allows measuring the tool’s effectiveness in an extreme situation. In case of failure of a key application, a hardware problem, a crashing disk, a server going down, the system configuration is there to allow it to function, thanks to the replication of software and hardware objects. But when a physical object like a radar experiences a failure, it floods the system with incorrect data. The notification system must therefore allow rapid isolation of the problem.
The alert system lists all system messages. It’s a log, and the principle is the same as in server administration. A journalctl -f /var/log/apache2 traces all system messages. The interface adds this: a filter allows refining log entries by filtering by error level. First, simple messages are removed from the display. Then, secondary errors fade away: only critical entries are displayed.
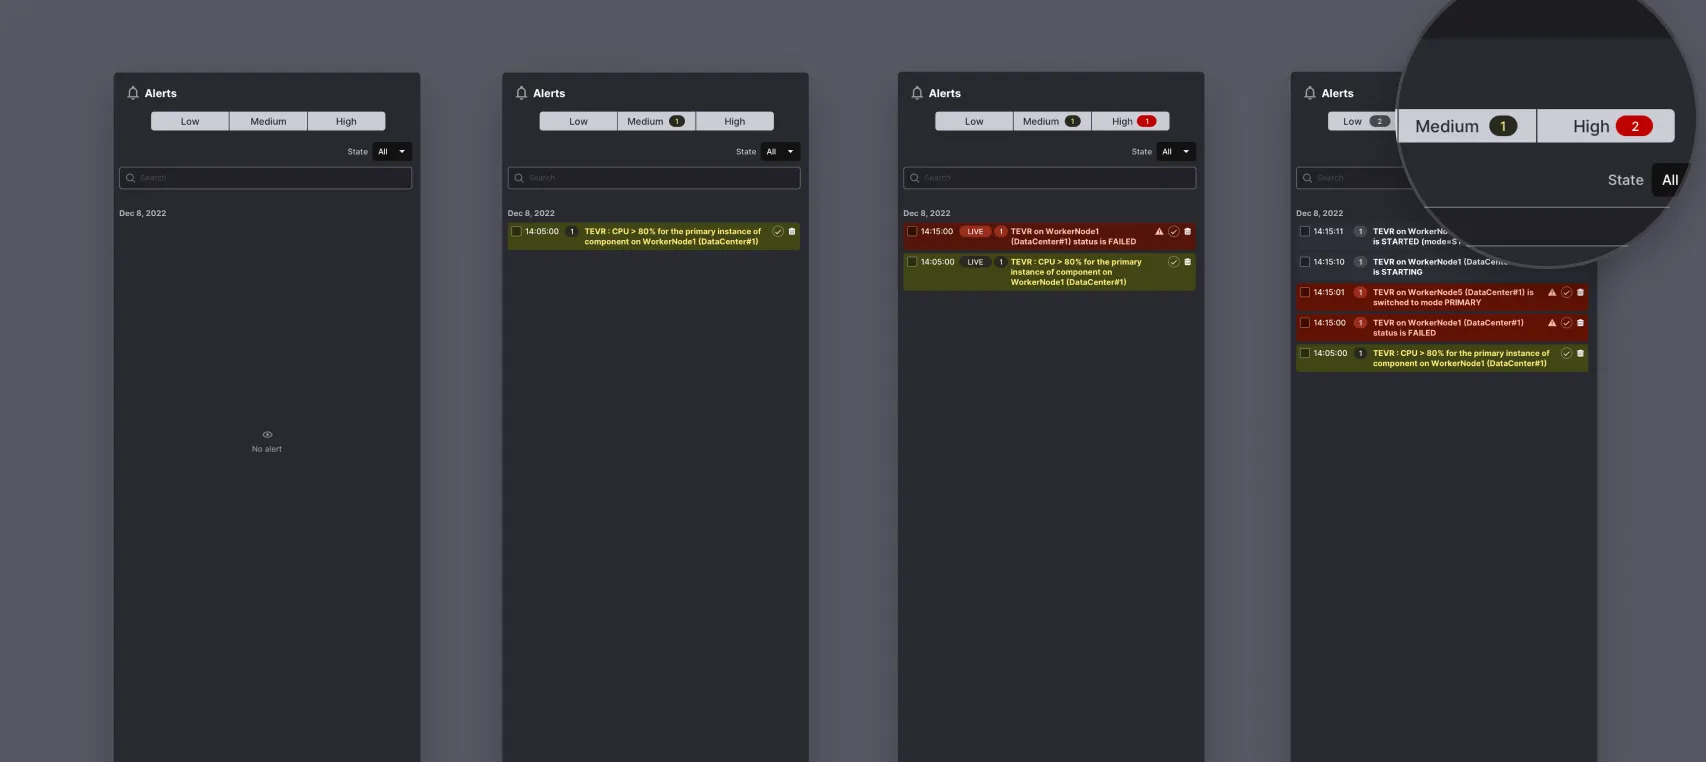
The number of occurrences of a critical alert must quickly put us on the trail of the problem. Expertise, obviously, and also the use of color and text. In this way, the display of the critical situation already gives an indication of the nature of the problem: is it a radar that has broken down? Is it an electrical problem in a data center? Is it a pod crashing? Where is there correlation, where is there causality?
Result
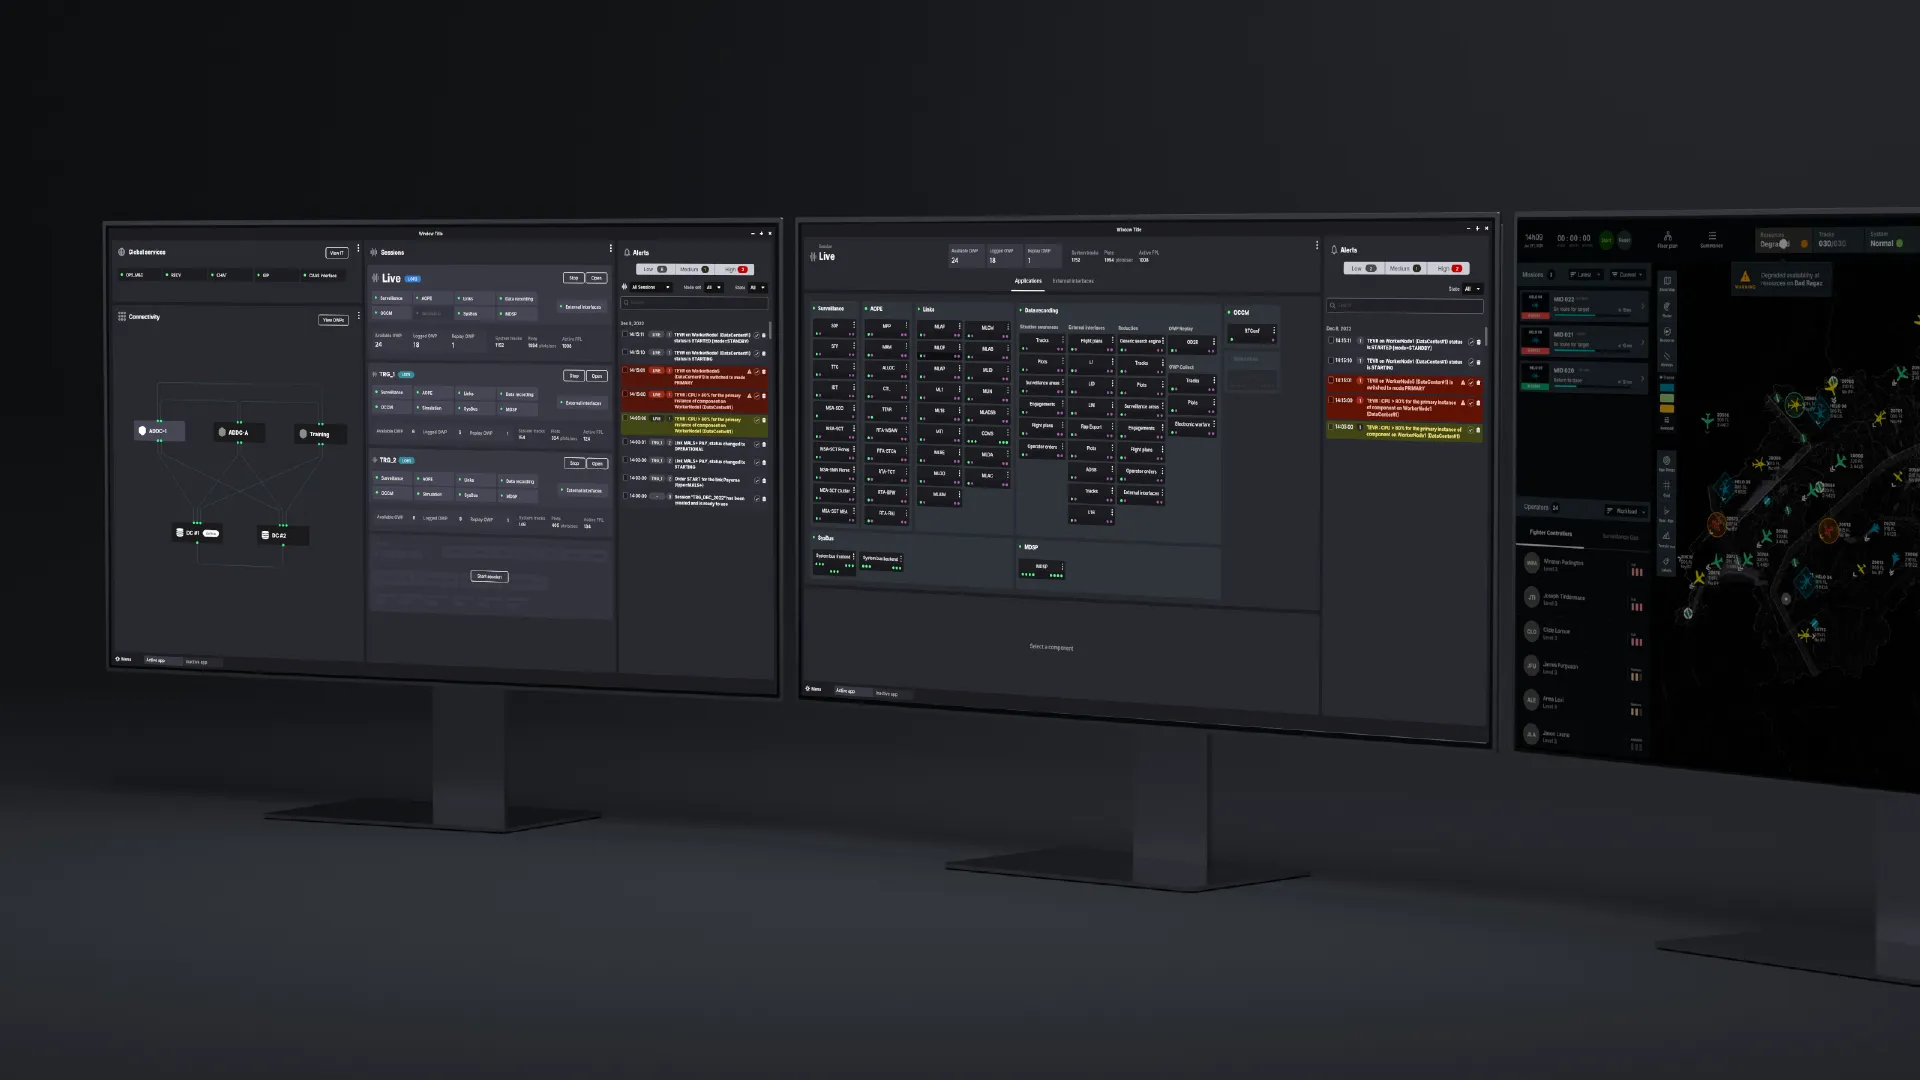
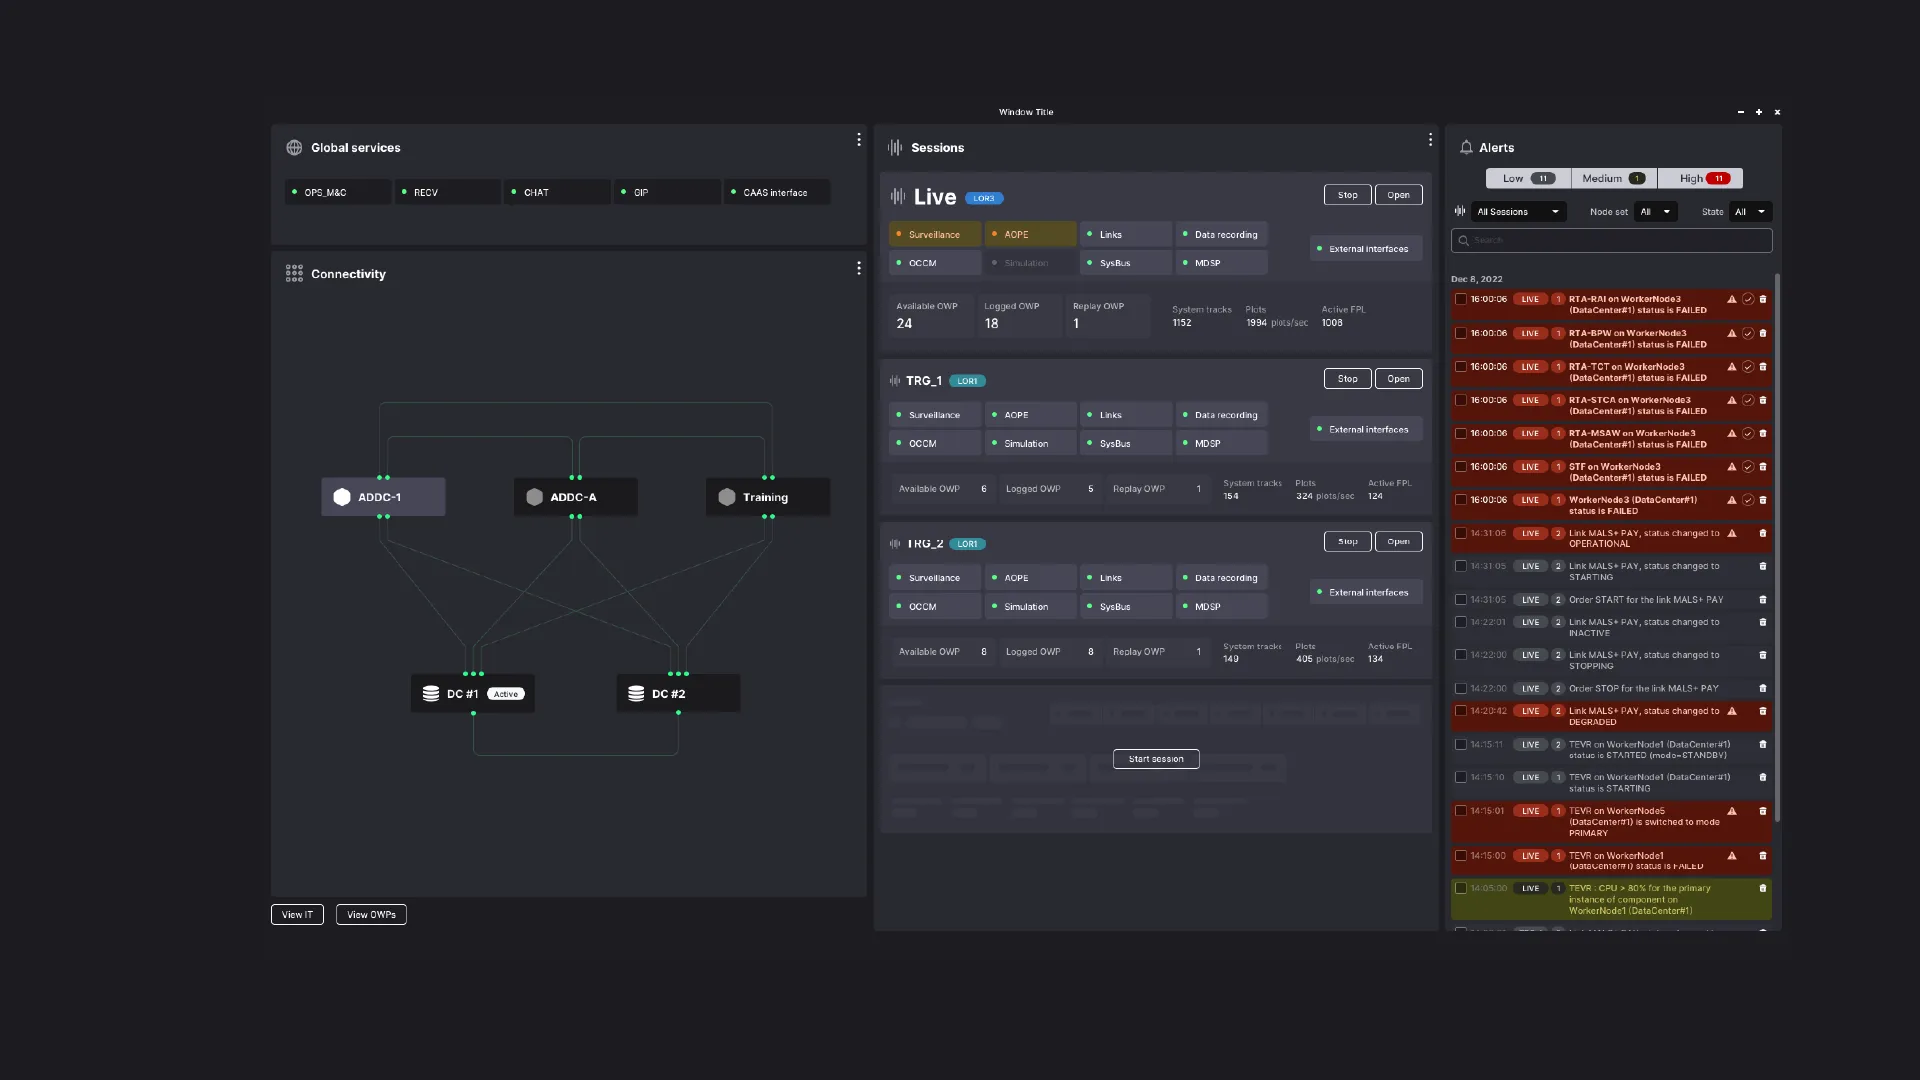
User expertise is essential, and the interface offers them an additional layer of meaning to help them understand the state of a system made up of physical objects and computer programs, distributed across a vast geographical area. The application therefore allows linking technical information and orchestrating it to offer supervision. It offers better quality communication between the different roles of data centers and operational centers, and faster drill-down of errors.
The two keys to the success of this work are
- Identify system objects, their nature, and their relationships. By doing this work, understanding of the system architecture is finer and allows identifying improvement axes
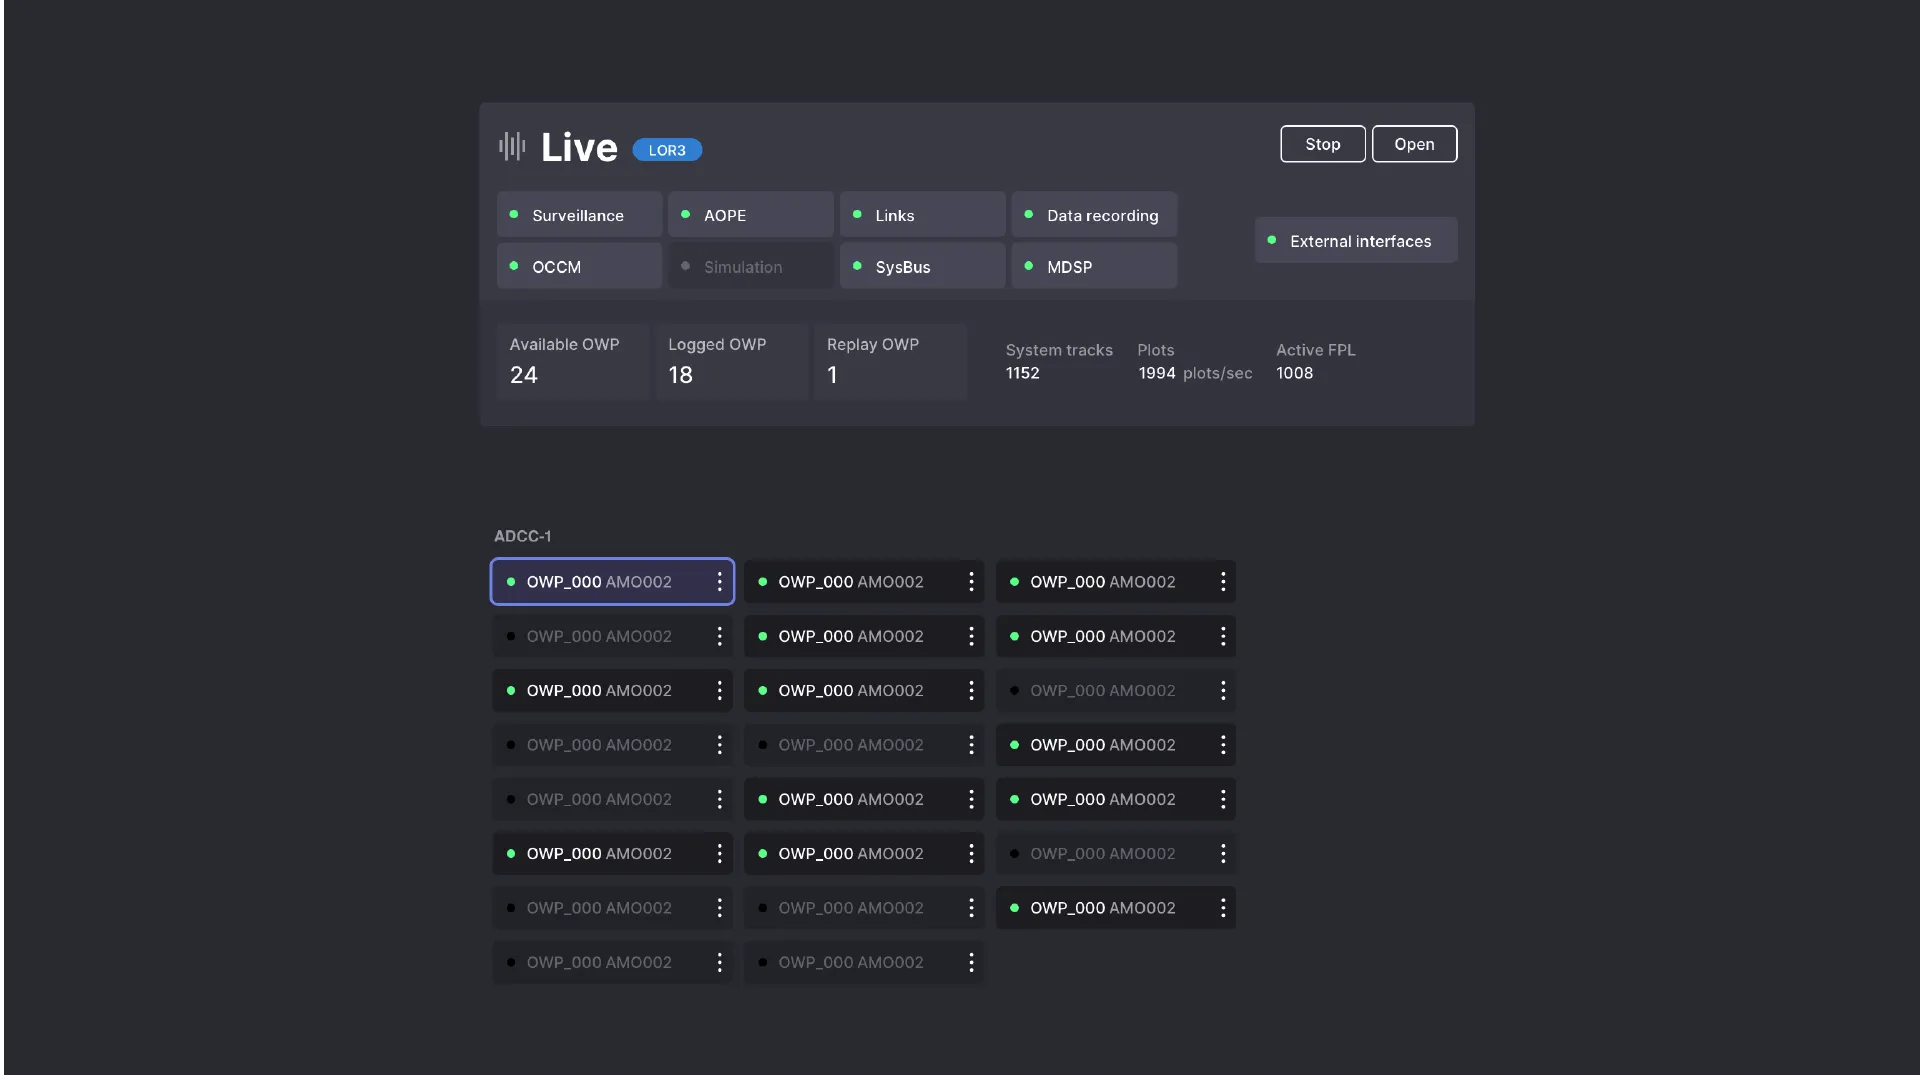
- Minimal graphic intervention: I see the result as a terminal, but with just enough graphics added: information is distributed in zones, with the help of different levels of gray. Color always brings precise meaning: problem with an object, and criticality, replication level, etc.
The second work naturally follows from the first.